

Microarray and functional analysis of growth phase-dependent gene regulation in Bordetella bronchiseptica
- PMID: 19667046
- PMCID: PMC2747918
- DOI: 10.1128/IAI.00136-09
Microarray and functional analysis of growth phase-dependent gene regulation in Bordetella bronchiseptica
Abstract
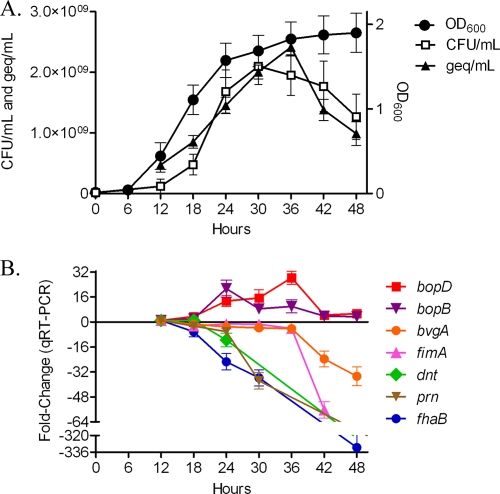
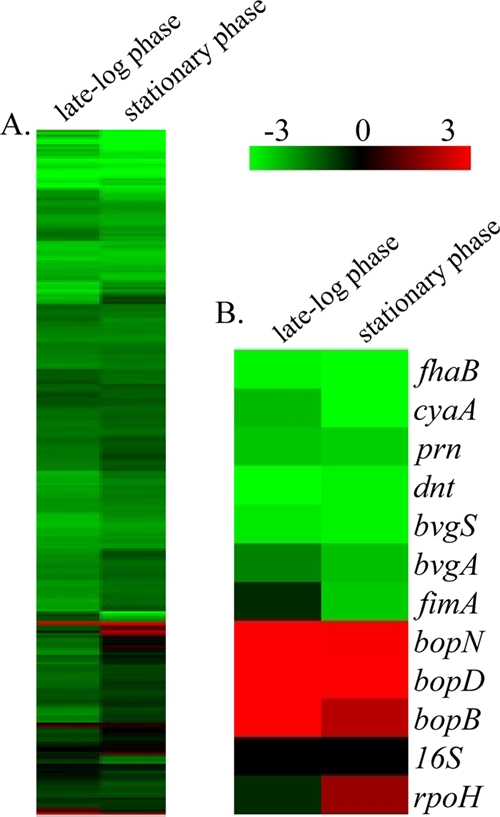
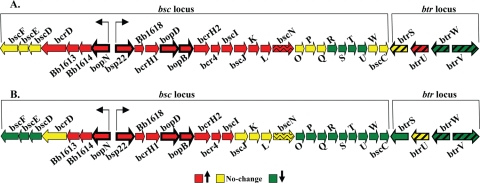
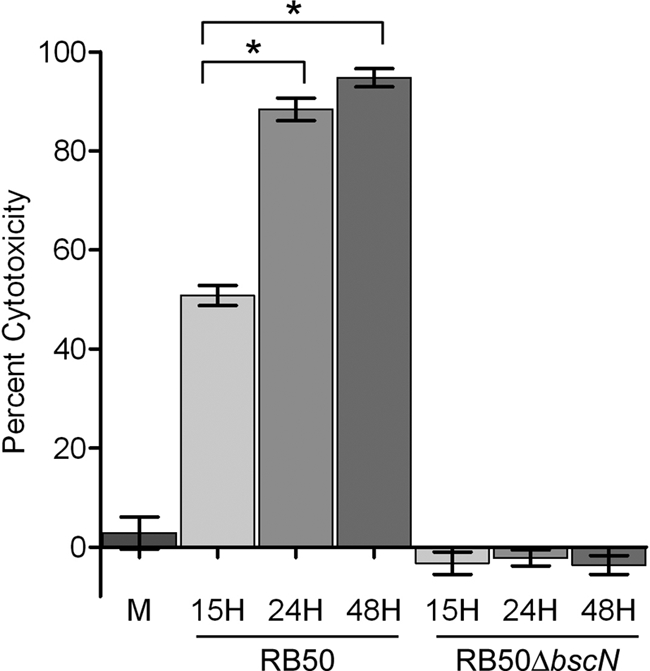
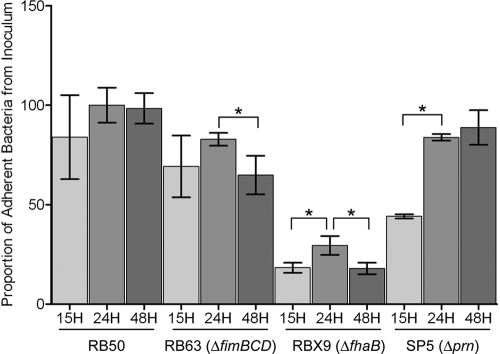
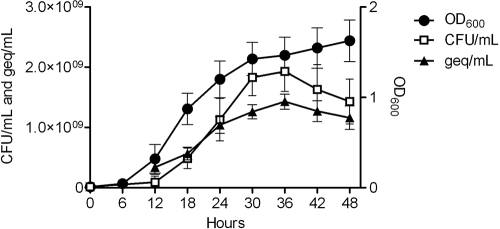
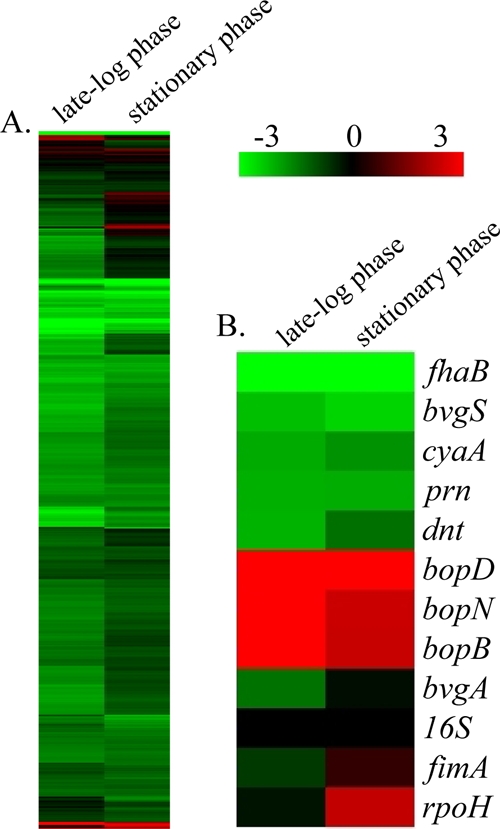
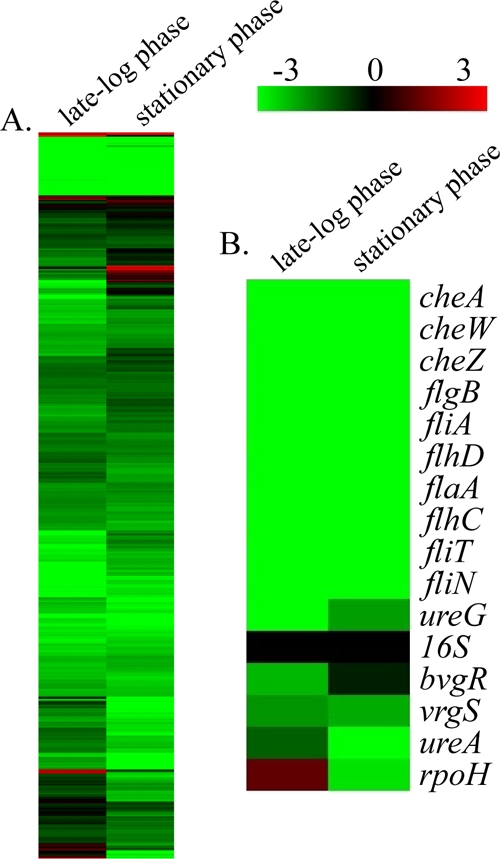
Growth phase-dependent gene regulation has recently been demonstrated to occur in Bordetella pertussis, with many transcripts, including known virulence factors, significantly decreasing during the transition from logarithmic to stationary-phase growth. Given that B. pertussis is thought to have derived from a Bordetella bronchiseptica-like ancestor, we hypothesized that growth phase-dependent gene regulation would also occur in B. bronchiseptica. Microarray analysis revealed and quantitative real-time PCR (qRT-PCR) confirmed that growth phase-dependent gene regulation occurs in B. bronchiseptica, resulting in prominent temporal shifts in global gene expression. Two virulence phenotypes associated with these gene expression changes were tested. We found that growth-dependent increases in expression of some type III secretion system (TTSS) genes led to a growth phase-dependent increase in a TTSS-dependent function, cytotoxicity. Although the transcription of genes encoding adhesins previously shown to mediate adherence was decreased in late-log and stationary phases, we found that the adherence of B. bronchiseptica did not decrease in these later phases of growth. Microarray analysis revealed and qRT-PCR confirmed that growth phase-dependent gene regulation occurred in both Bvg(+) and Bvg(-) phase-locked mutants, indicating that growth phase-dependent gene regulation in B. bronchiseptica can function independently from the BvgAS regulatory system.
Figures

Similar articles
-
Construction and validation of a first-generation Bordetella bronchiseptica long-oligonucleotide microarray by transcriptional profiling the Bvg regulon.BMC Genomics. 2007 Jul 6;8:220. doi: 10.1186/1471-2164-8-220. BMC Genomics. 2007. PMID: 17617915 Free PMC article.
-
The bvg-repressed gene brtA, encoding biofilm-associated surface adhesin, is expressed during host infection by Bordetella bronchiseptica.Microbiol Immunol. 2016 Feb;60(2):93-105. doi: 10.1111/1348-0421.12356. Microbiol Immunol. 2016. PMID: 26756546
-
An improved recombination-based in vivo expression technology-like reporter system reveals differential cyaA gene activation in Bordetella species.Infect Immun. 2013 Apr;81(4):1295-305. doi: 10.1128/IAI.01445-12. Epub 2013 Feb 4. Infect Immun. 2013. PMID: 23381998 Free PMC article.
-
Environmental sensing mechanisms in Bordetella.Adv Microb Physiol. 2001;44:141-81. doi: 10.1016/s0065-2911(01)44013-6. Adv Microb Physiol. 2001. PMID: 11407112 Review.
-
The BvgAS two-component system of Bordetella spp.: a versatile modulator of virulence gene expression.Int J Med Microbiol. 2001 May;291(2):119-30. doi: 10.1078/1438-4221-00109. Int J Med Microbiol. 2001. PMID: 11437335 Review.
Cited by
-
Evolutionary effects of translocations in bacterial genomes.Genome Biol Evol. 2012;4(12):1256-62. doi: 10.1093/gbe/evs099. Genome Biol Evol. 2012. PMID: 23160175 Free PMC article.
-
The contribution of BvgR, RisA, and RisS to global gene regulation, intracellular cyclic-di-GMP levels, motility, and biofilm formation in Bordetella bronchiseptica.Front Microbiol. 2024 Mar 7;15:1305097. doi: 10.3389/fmicb.2024.1305097. eCollection 2024. Front Microbiol. 2024. PMID: 38516008 Free PMC article.
-
Glutamate Limitation, BvgAS Activation, and (p)ppGpp Regulate the Expression of the Bordetella pertussis Type 3 Secretion System.J Bacteriol. 2015 Nov 2;198(2):343-51. doi: 10.1128/JB.00596-15. Print 2016 Jan 15. J Bacteriol. 2015. PMID: 26527639 Free PMC article.
-
Conquering the host: Bordetella spp. and Pseudomonas aeruginosa molecular regulators in lung infection.Front Microbiol. 2022 Sep 26;13:983149. doi: 10.3389/fmicb.2022.983149. eCollection 2022. Front Microbiol. 2022. PMID: 36225372 Free PMC article. Review.
-
Blood or Serum Exposure Induce Global Transcriptional Changes, Altered Antigenic Profile, and Increased Cytotoxicity by Classical Bordetellae.Front Microbiol. 2018 Sep 7;9:1969. doi: 10.3389/fmicb.2018.01969. eCollection 2018. Front Microbiol. 2018. PMID: 30245672 Free PMC article.
References
-
- Akerley, B. J., P. A. Cotter, and J. F. Miller. 1995. Ectopic expression of the flagellar regulon alters development of the Bordetella-host interaction. Cell 80:611-620. - PubMed
-
- Cotter, P. A., and A. M. Jones. 2003. Phosphorelay control of virulence gene expression in Bordetella. Trends Microbiol. 11:367-373. - PubMed
MeSH terms
Grants and funding
LinkOut - more resources
Full Text Sources
Other Literature Sources
Molecular Biology Databases
