. 2009 Oct;29(20):5632-8.
doi: 10.1128/MCB.00664-09. Epub 2009 Aug 10.

Coupled RNA processing and transcription of intergenic primary microRNAs

Affiliations

Coupled RNA processing and transcription of intergenic primary microRNAs

Monica Ballarino et al. Mol Cell Biol. 2009 Oct.

Abstract

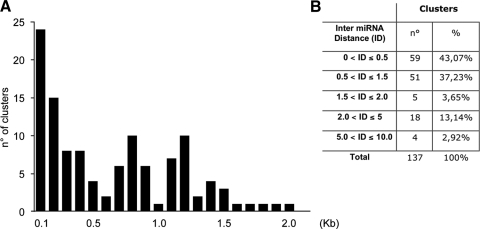
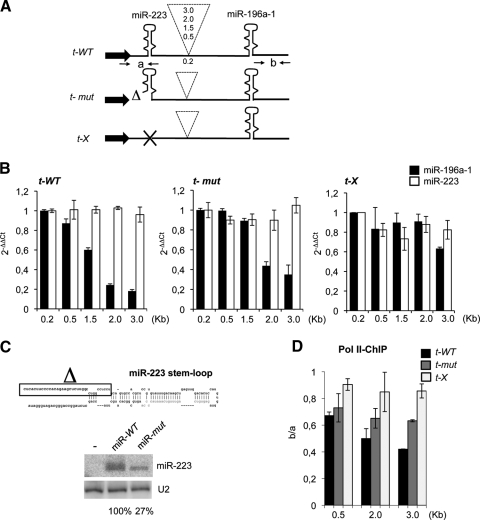
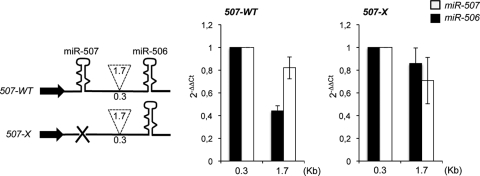
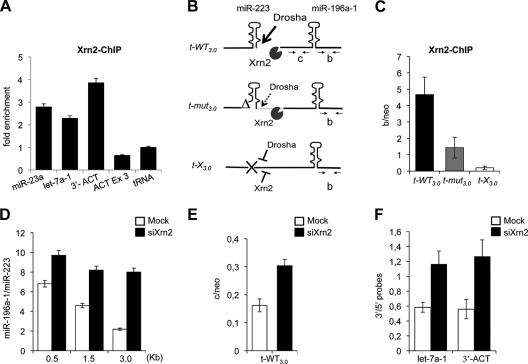
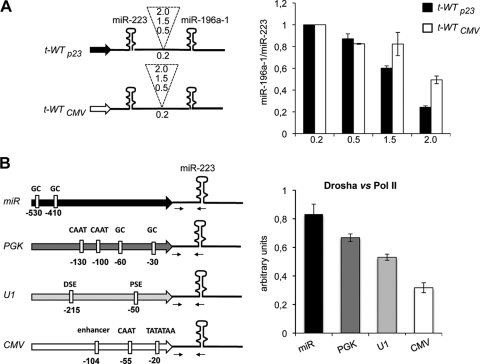
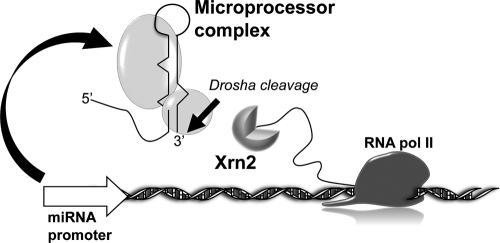
The first step in microRNA (miRNA) biogenesis occurs in the nucleus and is mediated by the Microprocessor complex containing the RNase III-like enzyme Drosha and its cofactor DGCR8. Here we show that the 5'-->3' exonuclease Xrn2 associates with independently transcribed miRNAs and, in combination with Drosha processing, attenuates transcription in downstream regions. We suggest that, after Drosha cleavage, a torpedo-like mechanism acts on nascent long precursor miRNAs, whereby Xrn2 exonuclease degrades the RNA polymerase II-associated transcripts inducing its release from the template. While involved in primary transcript termination, this attenuation effect does not restrict clustered miRNA expression, which, in the majority of cases, is separated by short spacers. We also show that transcripts originating from a miRNA promoter are retained on the chromatin template and are more efficiently processed than those produced from mRNA or snRNA Pol II-dependent promoters. These data imply that coupling between transcription and processing promotes efficient expression of independently transcribed miRNAs.


Figures

FIG. 1.
FIG. 1.
Genomic clusters display distance constraints. (A) Histogram showing the number of miRNA clusters (y axis) falling in each spacing category, spanning from 0.1 to 2.0 kb (x axis); (B) table showing the number of clusters in each distance subcategory (inter-miRNA distance [ID]).
FIG. 2.
FIG. 2.
Drosha cleavage induces transcriptional attenuation. (A) Schematic representation of dicistronic constructs containing pre-miR-223 and pre-miR-196a-1 under the control of the miR-23a promoter (black arrow) Spacer lengths are indicated in the dashed insert. t-WT contains wild-type pri-miR-223, t-mut has a suboptimal Drosha cleavage site, and t-X lacks the miR-223 hairpin. (B) Histograms show the level of miR196a-1 and miR-223 accumulation measured by qRT-PCR analysis on total RNA. For t-X constructs, miR196a-1 values were compared with the levels of miR-223 expressed from a cotransfected plasmid. 2−ΔΔCt, threshold cycle. (C) The upper panel shows human pre-miR-223 and 5′→3′ flanking sequences. The boxed sequence has been deleted in the t-mut constructs. For the lower panel, Northern blot analysis was performed with 10 μg of total RNA from HeLa cells untreated (lane −) or transfected with miR-WT or miR-mut plasmids. U2 snRNA was used as the loading control. Quantitation of the signals is shown below each lane. (D) Pol II ChIP of t-WT, t-mut, and t-X constructs containing 0.5-, 2.0-, and 3.0-kb spacer sequences. The y axis shows ChIP values as ratios of “b” versus “a” regions. Oligonucleotide pairs (“a” and “b”) are positioned as indicated by arrows in panel A. Error bars show standard errors of the mean based on three independent experiments.
FIG. 3.
FIG. 3.
Distance effect on natural clusters. (Left panel) Schematic representation of miR-507∼miR-506 cluster constructs. Spacer lengths are indicated in the dashed insert. (Middle and right panels) Histograms showing the level of miR-506 and miR-507 accumulation measured by qRT-PCR. For 507-X constructs, miR-506 values were compared with the levels of miR-507 expressed from a cotransfected plasmid. 2−ΔΔCt, threshold cycle. Error bars show standard errors of the mean based on three independent experiments.
FIG. 4.
FIG. 4.
Xrn2 is associated with miRNA chromatin. (A) Xrn2 ChIP on endogenous miR-23a-1 and let-7a-1 loci. The downstream region of the β-actin gene poly(A) site (3′-ACT) was used as the positive control. β-actin (ACT Ex3) and tRNA coding regions act as negative controls. The histogram shows enrichments over the tRNA. (B) Schematic representation of Drosha and Xrn2 action together with the oligonucleotides utilized. The drawing corresponds to nascent pri-miRNAs transcribed from the different tandem constructs. (C) Xrn2 ChIP on chromatin from t-WT3.0-, t-mut3.0-, and t-X3.0-transfected cells. The histogram shows the ratio between Xrn2 immunoprecipitation values in “b” regions (B) and the neomycin gene (“neo”) carried by each plasmid. (D) The histogram shows miR-196a-1 accumulation from mock- or Xrn2-depleted cells (white and black bars, respectively), transfected with three different tandem constructs. The relative ratios between miR-196a-1 and miR-223 obtained from Northern blot signal quantification (y axis) for the different t-WT constructs utilized (x axis) are indicated. Gels are provided in Fig. S2B in the supplemental material. (E) RNA analysis of 3′-cutoff transcripts from the t-WT3.0 construct expressed in mock- and Xrn2-depleted cells. qRT-PCR for the “c” region (B) and neomycin gene was performed with the C-F and C-R and neo-F and neo-R oligonucleotide pairs. (F) let-7a-1let-7f and β-actin transcript analysis in mock- and Xrn2-depleted cells. The histogram shows the levels of the 3′-cutoff products identified by qRT-PCR normalized against specific 5′ regions (3′/5′ probes). Positions of the oligonucleotide pairs are shown in Fig. S2C in the supplemental material. Error bars show standard errors of the mean based on three independent experiments.
FIG. 5.
FIG. 5.
Effects of miRNA, mRNA, and snRNA Pol II promoters on Drosha recruitment. (A) The left panel shows a schematic representation of the t-WTp23 (black arrow) and t-WTCMV (white arrow) dicistronic constructs. Spacer lengths are indicated in the dashed insert. The right panel is a histogram showing the ratio of miR196a-1 to miR-223 accumulation levels measured by qRT-PCR. (B) The left panel shows a schematic representation of the miR, PGK, U1, and CMV constructs. Regulatory sequence elements of each promoter are boxed in white. The right panel show a histogram of Drosha versus Pol II ChIP on PGK, U1, and CMV constructs after cotransfection with the miR construct in HeLa cells. The amplified regions are indicated by the arrows in the scheme. Raw data for Drosha and Pol II ChIP are listed in Fig. S3A in the supplemental material. Error bars show standard errors of the mean based on three independent experiments.
FIG. 6.
FIG. 6.
The “miRNA factory” model. Coupling between transcription and RNA processing of independently transcribed miRNAs is shown.

References

    1. Aguilera, A. 2005. Cotranscriptional mRNP assembly: from the DNA to the nuclear pore. Curr. Opin. Cell Biol. 17:242-250. - PubMed
    1. Ballarino, M., M. Morlando, F. Pagano, A. Fatica, and I. Bozzoni. 2005. The cotranscriptional assembly of snoRNPs controls the biosynthesis of H/ACA snoRNAs in Saccharomyces cerevisiae. Mol. Cell. Biol. 25:5396-5403. - PMC - PubMed
    1. Bentley, D. 2002. The mRNA assembly line: transcription and processing machines in the same factory. Curr. Opin. Cell Biol. 14:336-342. - PubMed
    1. Buratowski, S. 2005. Connections between mRNA 3′ end processing and transcription termination. Curr. Opin. Cell Biol. 17:257-261. - PubMed
    1. Chakrabarti, S. K., J. C. James, and R. G. Mirmira. 2002. Quantitative assessment of gene targeting in vitro and in vivo by the pancreatic transcription factor, Pdx1. Importance of chromatin structure in directing promoter binding. J. Biol. Chem. 277:13286-13293. - PubMed

Publication types

MeSH terms

LinkOut - more resources