. 2009 Oct;29(20):5564-77.
doi: 10.1128/MCB.00590-09. Epub 2009 Aug 10.

A role for polypyrimidine tract binding protein in the establishment of focal adhesions

Affiliations

A role for polypyrimidine tract binding protein in the establishment of focal adhesions

Ivan Babic et al. Mol Cell Biol. 2009 Oct.

Abstract

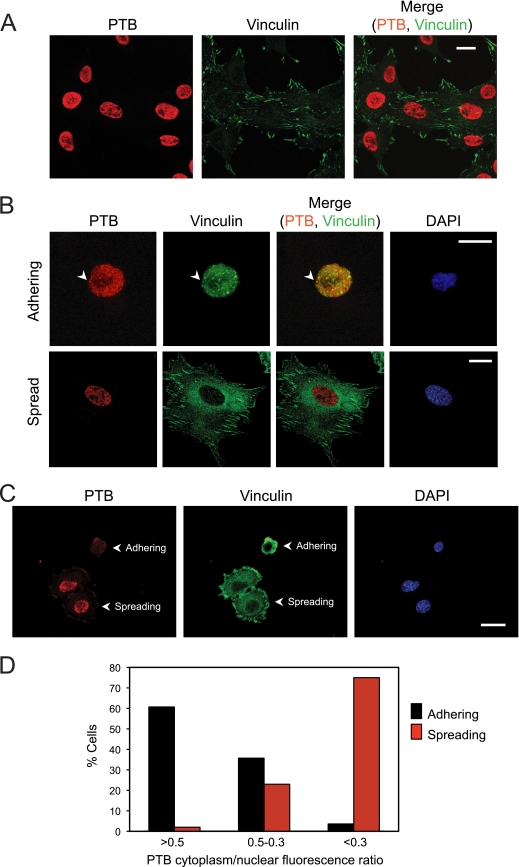
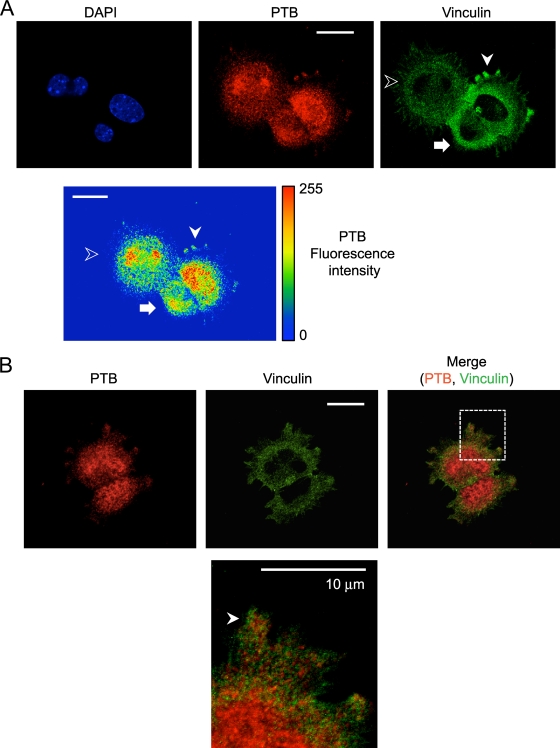
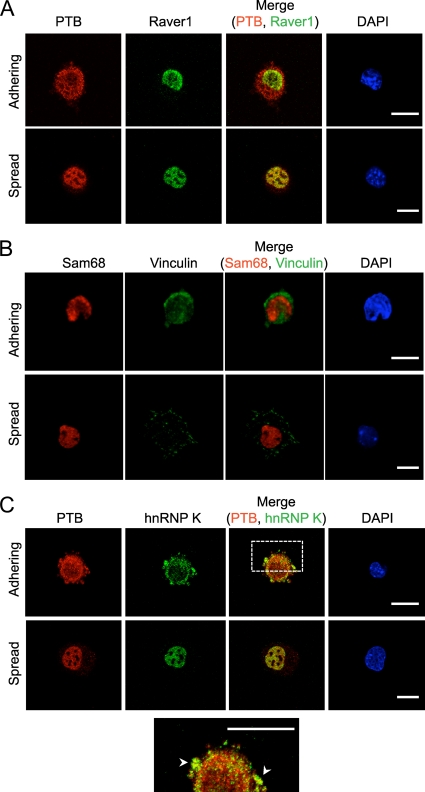
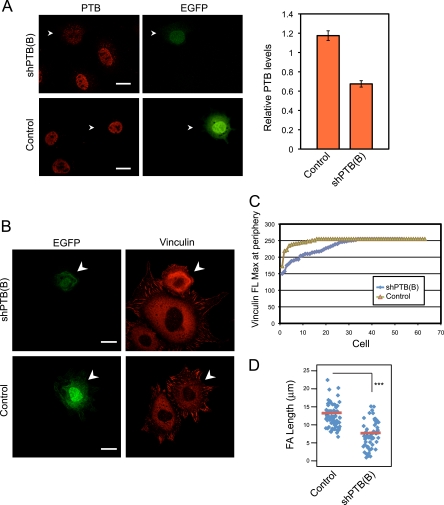
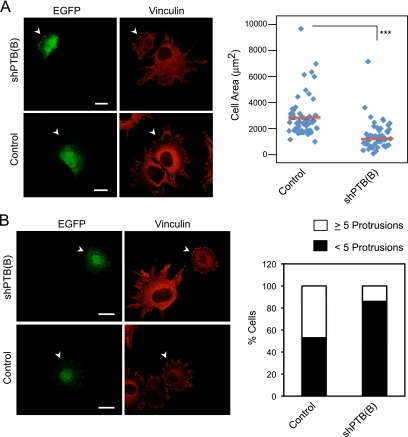
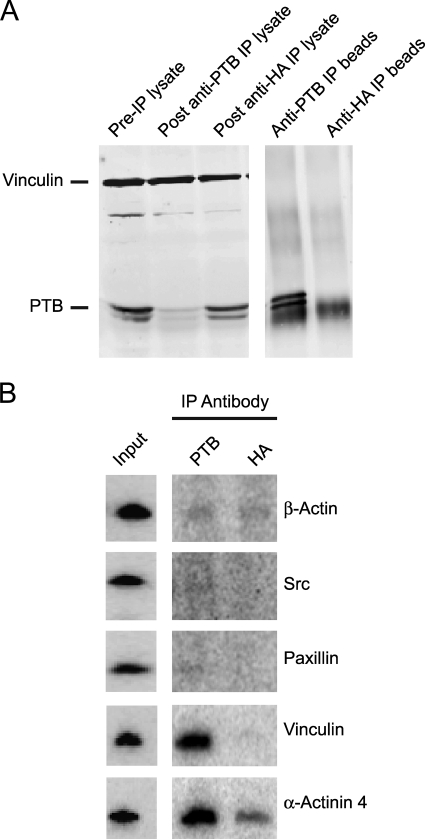
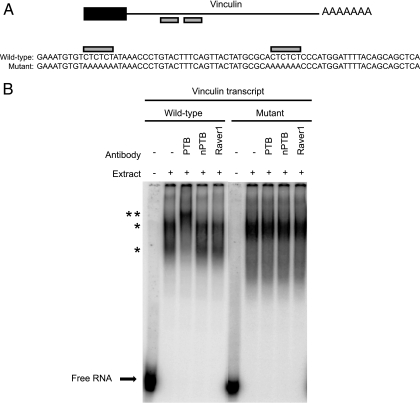
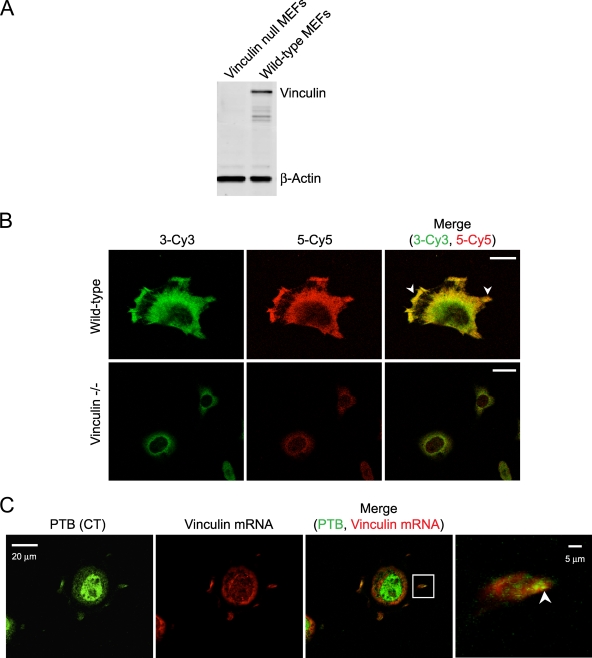
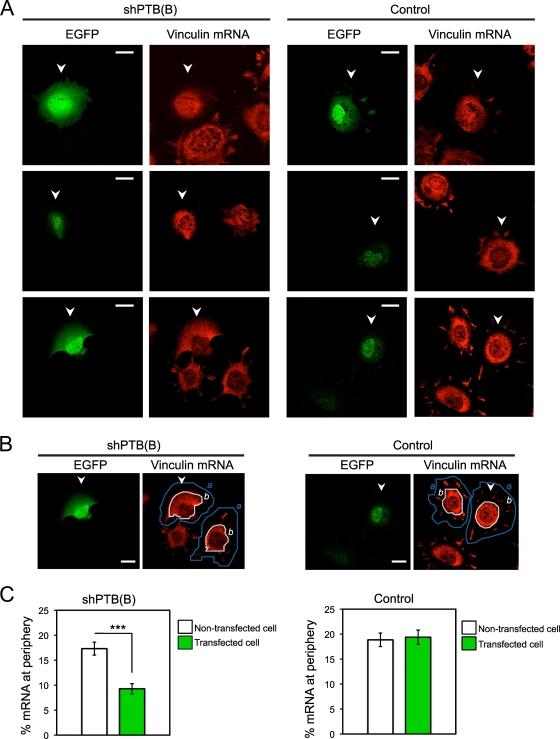
Polypyrimidine tract binding protein (PTB) is a widely expressed RNA binding protein. In the nucleus PTB regulates the splicing of alternative exons, while in the cytoplasm it can affect mRNA stability, translation, and localization. Here we demonstrate that PTB transiently localizes to the cytoplasm and to protrusions in the cellular edge of mouse embryo fibroblasts during adhesion to fibronectin and the early stages of cell spreading. This cytoplasmic PTB is associated with transcripts encoding the focal adhesion scaffolding proteins vinculin and alpha-actinin 4. We demonstrate that vinculin mRNA colocalizes with PTB to cytoplasmic protrusions and that PTB depletion reduces vinculin mRNA at the cellular edge and limits the size of focal adhesions. The loss of PTB also alters cell morphology and limits the ability of cells to spread after adhesion. These data indicate that during the initial stages of cell adhesion, PTB shuttles from the nucleus to the cytoplasm and influences focal adhesion formation through coordinated control of scaffolding protein mRNAs.


Figures

FIG. 1.
FIG. 1.
PTB relocalizes from the nucleus to the cytoplasm during adhesion. (A) MEFs were plated on fibronectin. After 24 h, the cells were fixed and immunostained with antibodies to PTB and vinculin. (B) MEFs were lifted, maintained in suspension for 1 h, and replated on fibronectin. Cells were allowed to adhere for 12 min (adhering) or 90 min (spread). Nonadhered cells were removed by washing, cells were fixed, and immunofluorescence was performed with antibodies to PTB and vinculin. The arrowhead shows PTB vinculin colocalization at a possible SIC. (C) MEFs adhered for 15 min were fixed and immunofluorescence performed with anti-PTB and antivinculin antibodies. Adhering cells were identified by an absence of focal adhesions (punctate vinculin staining in the cytoplasm), and spreading cells were identified by the presence of focal adhesions at the cell periphery. (D) The mean fluorescence intensity for PTB across the nucleus and the cytoplasm was determined for both adhering and spreading cells using Zeiss image analysis software. Cells were grouped as having a PTB cytoplasm-to-nucleus ratio of either >0.5, 0.5 to 0.3, or <0.3 (n = 56 for adhering and n = 47 for spreading). Magnification, ×40 (A) or ×63 (B and C). Scale bars, 20 μm.
FIG. 2.
FIG. 2.
PTB localizes to cell protrusions during early cell spreading. MEFs were fixed after 20 min of adhesion to fibronectin and immunostained with antibodies to PTB and vinculin. (A) An adhering cell is indicated by the arrow, and an early spreading cell with PTB in protrusions is indicated by the white arrowhead. A more fully spread cell with elongated focal adhesions is indicated with the unfilled arrowhead. The heat map shows the fluorescence intensity of the PTB. (B) The arrowhead in the enlarged image in the bottom panel indicates a protrusion with PTB staining adjacent to vinculin staining. Scale bars, 20 μm, except the enlarged image in panel B (10 μm).
FIG. 3.
FIG. 3.
hnRNP K, but not Raver1 or Sam68, relocalizes to the cytoplasm during cell adhesion. MEFs were lifted and maintained in serum-free medium on a rotator for 1 h at 37°C and then replated on fibronectin-coated coverslips in the presence of serum. Cells were incubated for 15 min (adhering) or overnight (spread), fixed, and immunostained with antibodies to Raver1 and PTB (A), Sam68 and vinculin (B), or PTB and hnRNP K (C). Adhering cells were identified by cytoplasmic staining for PTB (A and C) or by punctate vinculin staining (B). The expanded view at the bottom shows a partial overlap between PTB and hnRNP K in the cytoplasm and periphery. Arrowheads indicate regions of colocalization. Scale bars, 20 μm.
FIG. 4.
FIG. 4.
PTB knockdown decreases vinculin levels at the cell periphery and decreases the size of vinculin-containing focal adhesions. (A) MEFs were transfected either with empty vector (control) or with vector expressing a short hairpin targeting PTB [shPTB(B)]. After 3 days, cells were fixed and stained with anti-PTB antibody. The arrowhead indicates a green fluorescent protein-positive transfected cell. Scale bars, 20 μm. The mean fluorescence for PTB in the nucleus was measured for transfected and nontransfected cells from the same optical fields. The mean ratio of PTB fluorescence in transfected cells relative to that in nontransfected cells is plotted in the graph ± standard errors of the means [control, n = 72; shPTB(B), n = 65]. (B) MEFs transfected as for panel A were lifted and allowed to readhere to fibronectin for 90 min. The cells were fixed and stained for vinculin. Arrowheads indicate GFP-positive transfected cells. The shPTB(B)-transfected cells display less vinculin staining at the periphery and smaller focal adhesions. Scale bars, 20 μm. (C) The vinculin staining at the cell periphery of control and PTB knockdown cells was quantified using Zeiss image analysis software, and the maximum vinculin fluorescence (FL Max) at the periphery for each cell was plotted. Each data point represents a single cell examined. (D) Length of the longest focal adhesion (FA) for each cell was measured and the results displayed as a scatter plot. The red bar shows the mean, and asterisks indicate statistical significance measured by a paired t test (***, P < 0.0001). The numbers of cells measured are as follows: control, n = 63; shPTB(B), n = 52.
FIG. 5.
FIG. 5.
PTB knockdown decreases the cell area and number of protrusions formed during spreading. The extent of cell spreading and protrusion formation in MEFs treated as for Fig. 4B was compared between PTB knockdown and control cells. (A) Arrowheads indicate a green fluorescent protein-positive transfected cell. The cell surface area was measured using Zeiss image analysis software and data displayed as a scatter plot. For the control, n = 53; for shPTB(B), n = 51. The red bar in the plot shows the mean, and asterisks indicate statistical significance measured by paired t test (***, P < 0.0001). (B) Cells were also scored for number of protrusions formed during spreading. The panel on the left shows shPTB(B)-transfected cells with fewer protrusions than nontransfected cells or control-transfected cells. Arrowheads indicate a green fluorescent protein-positive transfected cell. The graph on the right shows the percentage of transfected cells having five or more protrusions or fewer than five protrusions [n = 53 for the control; n = 51 for shPTB(B)]. Scale bars, 20 μm.
FIG. 6.
FIG. 6.
Transcripts encoding focal adhesion scaffolding proteins associate with PTB in the cytoplasm of adhering cells. MEFs were lifted and maintained in suspension for 1 h, replated on fibronectin, and allowed to adhere for 20 min. Nonadhered cells were removed by washing. The remaining cells were UV irradiated to cross-link protein to RNA, the cytoplasmic fraction was isolated, and IP was performed with either anti-PTB or anti-HA control antibody. RNA in the immunoprecipitate was isolated, cDNA synthesized, and RT-PCR performed using primers for various focal adhesion protein transcripts. (A) Western blot for PTB and vinculin in the cell lysate and the IP. (B) RT-PCR for various focal adhesion transcripts using cDNA prepared from the IPs. Input is from cDNA prepared from RNA isolated from the pre-IP lysate.
FIG. 7.
FIG. 7.
PTB binds CU repeats in the 3′ UTR of vinculin transcript. (A) Schematic showing potential PTB binding sites in the 3′ UTR of mouse vinculin mRNA. The black box indicates the carboxy-terminal coding region, the black line indicates the 3′ UTR, and the gray boxes highlight CU repeats. Transcripts synthesized for PTB binding experiments are shown below the schematic. Wild-type transcript corresponding to the CU repeat region (gray boxes) of the vinculin mRNA and a mutant transcript in which the CU repeats were changed to AA repeats are shown. (B) EMSA analysis of wild-type and mutant vinculin transcripts in HeLa nuclear extract. Labeled transcript was incubated with HeLa nuclear extract for 30 min and then incubated with the indicated antibodies to supershift RNA/protein complexes. Free RNA is shown at the bottom of the gel. A single asterisk identifies shifted RNP complexes, and the double asterisk identifies antibody-supershifted complexes.
FIG. 8.
FIG. 8.
Vinculin mRNA colocalizes with PTB to the cell periphery of spreading fibroblasts. (A) Western blot for vinculin and beta-actin in wild-type and vinculin null MEFs shows an absence of vinculin protein in the null cells. (B) Wild-type and vinculin null MEFs were fixed with 4% PFA, and in situ hybridization was performed with two riboprobes specific to different regions of the 3′ UTR of vinculin mRNA. Riboprobe 3 was Cy3 labeled, and riboprobe 5 was Cy5 labeled. The arrowheads identify vinculin mRNA localization to protrusions and cell periphery. (C) Cells allowed to adhere for 20 min were fixed and immunofluorescence performed with anti-PTB (CT) antibody. Cells were postfixed with PFA, and in situ hybridization was performed with Cy3-labeled vinculin riboprobes 3 and 5 combined. The arrowhead in the enlarged image identifies regions of colocalization in newly formed protrusions. Scale bars, 20 μm except in the enlarged images to the right in panel C (5 μm).
FIG. 9.
FIG. 9.
PTB knockdown decreases localization of vinculin mRNA to the cell periphery. (A) MEFs were transfected with shPTB(B) or empty vector (control). After 3 days, cells were replated on fibronectin and allowed to adhere for 90 min as described previously. FISH was performed using vinculin-specific probes (riboprobes 3 and 5 combined). Shown are representative images from three independent experiments of knockdown and control cells hybridized with labeled vinculin transcript. Arrowheads indicate GFP-positive transfected cells. (B) Vinculin mRNA fluorescence signal at the outer regions of transfected and nontransfected cells in the same optical field was quantitated as follows: total fluorescence for a cell (a, fluorescence total within the area outlined by the blue line) and the total fluorescence within the main cell body (b, fluorescence total within the area outlined by the white line) were calculated, and the percentage of mRNA localizing to the cell peripheral region was then calculated as (ab)/a. This calculation was performed for a transfected cell and a nontransfected cell in the same optical field. Arrowheads indicate GFP-positive transfected cells. Scale bars, 20 μm. (C) The data show the means ± standard errors of the means from three independent experiments [for shPTB(B), n = 60 nontransfected and transfected cells; for control, n = 60 nontransfected and transfected cells). The asterisks indicate statistical significance measured by a paired t test (***, P < 0.0001).

Similar articles

Cited by

References

    1. Auweter, S. D., and F. H. Allain. 2008. Structure-function relationships of the polypyrimidine tract binding protein. Cell Mol. Life Sci. 65:516-527. - PMC - PubMed
    1. Back, S. H., Y. K. Kim, W. J. Kim, S. Cho, H. R. Oh, J. E. Kim, and S. K. Jang. 2002. Translation of polioviral mRNA is inhibited by cleavage of polypyrimidine tract-binding proteins executed by polioviral 3C(pro). J. Virol. 76:2529-2542. - PMC - PubMed
    1. Besse, F., S. Lopez de Quinto, V. Marchand, A. Trucco, and A. Ephrussi. 2009. Drosophila PTB promotes formation of high-order RNP particles and represses oskar translation. Genes Dev. 23:195-207. - PMC - PubMed
    1. Bomsztyk, K., O. Denisenko, and J. Ostrowski. 2004. hnRNP K: one protein multiple processes. Bioessays 26:629-638. - PubMed
    1. Boutz, P. L., G. Chawla, P. Stoilov, and D. L. Black. 2007. MicroRNAs regulate the expression of the alternative splicing factor nPTB during muscle development. Genes Dev. 21:71-84. - PMC - PubMed

Publication types