Clinical Trial
. 2009 Aug 25;106(34):14728-33.
doi: 10.1073/pnas.0904489106. Epub 2009 Aug 10.

Pharmacometabonomic identification of a significant host-microbiome metabolic interaction affecting human drug metabolism

Affiliations
Clinical Trial

Pharmacometabonomic identification of a significant host-microbiome metabolic interaction affecting human drug metabolism

T Andrew Clayton et al. Proc Natl Acad Sci U S A. .

Abstract

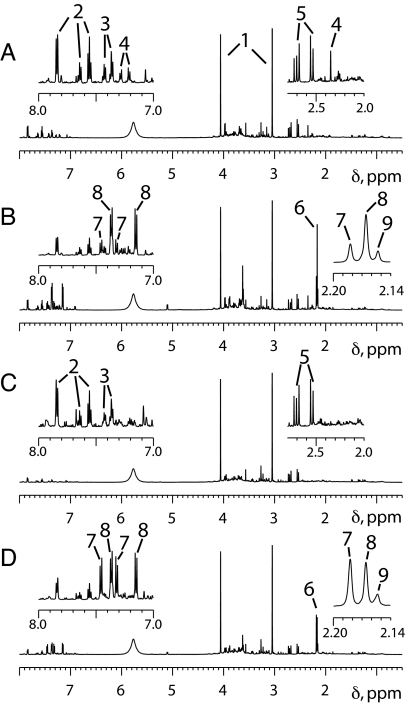
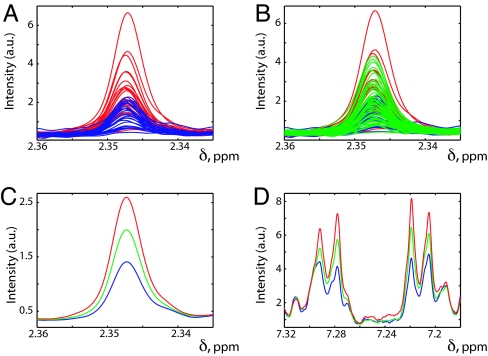
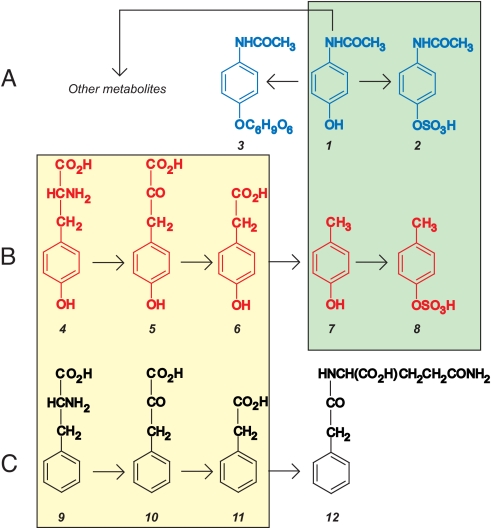
We provide a demonstration in humans of the principle of pharmacometabonomics by showing a clear connection between an individual's metabolic phenotype, in the form of a predose urinary metabolite profile, and the metabolic fate of a standard dose of the widely used analgesic acetaminophen. Predose and postdose urinary metabolite profiles were determined by (1)H NMR spectroscopy. The predose spectra were statistically analyzed in relation to drug metabolite excretion to detect predose biomarkers of drug fate and a human-gut microbiome cometabolite predictor was identified. Thus, we found that individuals having high predose urinary levels of p-cresol sulfate had low postdose urinary ratios of acetaminophen sulfate to acetaminophen glucuronide. We conclude that, in individuals with high bacterially mediated p-cresol generation, competitive O-sulfonation of p-cresol reduces the effective systemic capacity to sulfonate acetaminophen. Given that acetaminophen is such a widely used and seemingly well-understood drug, this finding provides a clear demonstration of the immense potential and power of the pharmacometabonomic approach. However, we expect many other sulfonation reactions to be similarly affected by competition with p-cresol and our finding also has important implications for certain diseases as well as for the variable responses induced by many different drugs and xenobiotics. We propose that assessing the effects of microbiome activity should be an integral part of pharmaceutical development and of personalized health care. Furthermore, we envisage that gut bacterial populations might be deliberately manipulated to improve drug efficacy and to reduce adverse drug reactions.


Conflict of interest statement

Conflict of interest statement: T.A.C., J.C.L., J.R.E., and J.K.N. are inventors on a relevant patent application from which financial gain might be derived. T.A.C., J.C.L., and J.K.N. might also benefit financially from the future placement of related analytical or research contracts.

Figures

Fig. 1.
Fig. 1.
Representative 1H NMR spectra of urine samples provided before and after taking 1 g of acetaminophen. (A) The δ 8.0–0.5 region of the predose urine spectrum for a subject whose urine contained a relatively high level of p-cresol sulfate. (B) The corresponding 0–3 h postdose urine spectrum, which shows a relatively low ratio of acetaminophen sulfate to acetaminophen glucuronide. (C) The δ 8.0–0.5 region of the predose urine spectrum for a subject whose urine did not contain a high level of p-cresol sulfate. (D) The corresponding 0–3 h postdose spectrum, which shows a relatively high ratio of acetaminophen sulfate to acetaminophen glucuronide. To facilitate their comparison, all these spectra were processed in the same way, without resolution enhancement and with a digital filter used to minimize the residual water features, which would otherwise be observed at ≈δ 4.7. Furthermore, each spectrum has been scaled so that the creatinine methylene peak at ≈δ 4.06 is just on scale (with the result that the corresponding creatinine methyl peak at ≈δ 3.05 is off scale in each case). The Insets, which are expansions of selected spectral regions, are scaled to fill the available space. Key to numbered peaks: 1, creatinine; 2, hippurate; 3, phenylacetylglutamine; 4, p-cresol sulfate; 5, citrate; 6, cluster of N-acetyl groups from acetaminophen-related compounds; 7, acetaminophen sulfate; 8, acetaminophen glucuronide; 9, other acetaminophen-related compounds.
Fig. 2.
Fig. 2.
Selected regions of 1H NMR spectra obtained from predose urine samples with color-coding according to postdose behavior. All of the plots were produced in MATLAB with each individual NMR spectrum being normalized to constant creatinine. (A) An expansion of the δ 2.335–2.360 spectral region, which contains the methyl signal from p-cresol sulfate (PCS), with the individual spectra for the 25 subjects giving the highest postdose 0–3 h S/G ratios shown in blue and superimposed on the individual spectra for the 25 subjects giving the lowest postdose 0–3 h S/G ratios shown in red. (B) The same plot as A but with the further addition of the corresponding data for the other 49 subjects (shown in green). (C) The same spectral region and the average spectra for the 3 different groups, with the same color coding. (D) The same average predose spectra, with the same color coding, over the region of δ 7.18–7.32, which contains the PCS aromatic signals (the pair of pseudo “doublets” centered at ≈δ 7.21 and at ≈δ 7.29). In all plots “a.u.” designates arbitrary units. In plots A and B, some spectra are obscured by the subsequently superimposed spectra.
Fig. 3.
Fig. 3.
Relevant metabolic pathways. (A) The hydroxyl group of acetaminophen (1) may be sulfonated to produce acetaminophen sulfate (2) or glucuronidated to produce acetaminophen glucuronide (3). (B) Stepwise production of p-cresol sulfate (8) from tyrosine (4) (23). The green box highlights the highly analogous and potentially competitive sulfonation of acetaminophen and p-cresol (25, 26). (C) Stepwise production of phenylacetylglutamine (12) from phenylalanine (9) (23) with the yellow box highlighting similarities with the metabolism of tyrosine. Key to compounds: 1, acetaminophen; 2, acetaminophen sulfate; 3, acetaminophen glucuronide; 4, tyrosine; 5, 4-hydroxyphenylpyruvic acid; 6, 4-hydroxyphenylacetic acid; 7, p-cresol; 8, p-cresol sulfate; 9, phenylalanine; 10, phenylpyruvic acid; 11, phenylacetic acid; 12, phenylacetylglutamine. In the body, compounds 2 and 8 would normally be expected to exist as ROSO3 rather than as ROSO3H, where R designates the remainder of each molecule.
Fig. 4.
Fig. 4.
The observed relationship between the predose urinary ratio of p-cresol sulfate (PCS) to creatinine and the postdose urinary ratio of the major acetaminophen metabolites: acetaminophen sulfate (S) and acetaminophen glucuronide (G). (A) The predose urinary PCS/creatinine integral ratio for each subject plotted against the corresponding urinary S/G ratio obtained in the 0–3 h postdose collection. (B) The corresponding plot for the 3–6 h postdose collection. I.R. designates the integral ratio of the peaks at ≈δ 2.35 and at ≈δ 4.06 in the 1H NMR spectrum recorded from the predose urine sample. For equimolar PCS and creatinine, I.R. would be expected to be approximately 1.5 because of the number of protons contributing to each signal. No subjects were excluded from either plot.

Comment in

References

    1. Evans WE, Relling MV. Pharmacogenomics: Translating functional genomics into rational therapeutics. Science. 1999;286:487–491. - PubMed
    1. Evans WE, Johnson JA. Pharmacogenomics: The inherited basis for interindividual differences in drug response. Annu Rev Genomics Hum Genet. 2001;2:9–39. - PubMed
    1. Spear BB, Heath-Chiozzi M, Huff J. Clinical application of pharmacogenetics. Trends Mol Med. 2001;7:201–204. - PubMed
    1. Pagliarulo V, Datar RH, Cote RJ. Role of genetic and expression profiling in pharmacogenomics: The changing face of patient management. Curr Issues Mol Biol. 2002;4:101–110. - PubMed
    1. Evans WE, Relling MV. Moving towards individualized medicine with pharmacogenomics. Nature. 2004;429:464–468. - PubMed

Publication types

MeSH terms