. 2009 Aug 25;106(34):14478-83.
doi: 10.1073/pnas.0900198106. Epub 2009 Aug 10.

Chromosome 14 transfer and functional studies identify a candidate tumor suppressor gene, mirror image polydactyly 1, in nasopharyngeal carcinoma

Affiliations

Chromosome 14 transfer and functional studies identify a candidate tumor suppressor gene, mirror image polydactyly 1, in nasopharyngeal carcinoma

Arthur Kwok Leung Cheung et al. Proc Natl Acad Sci U S A. .

Abstract

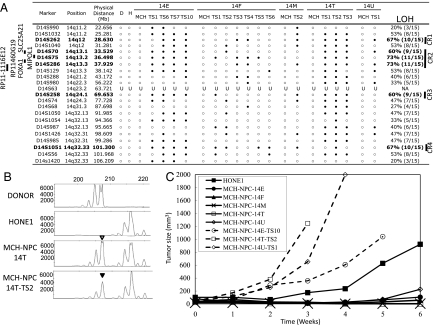
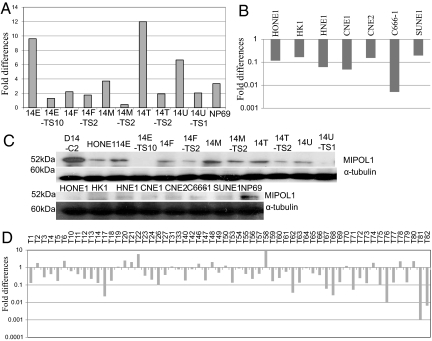
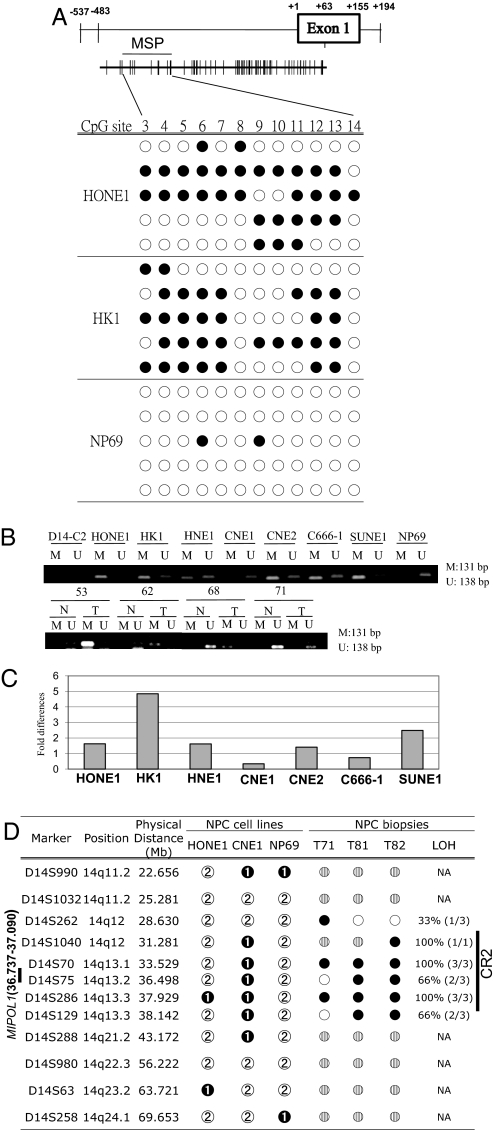
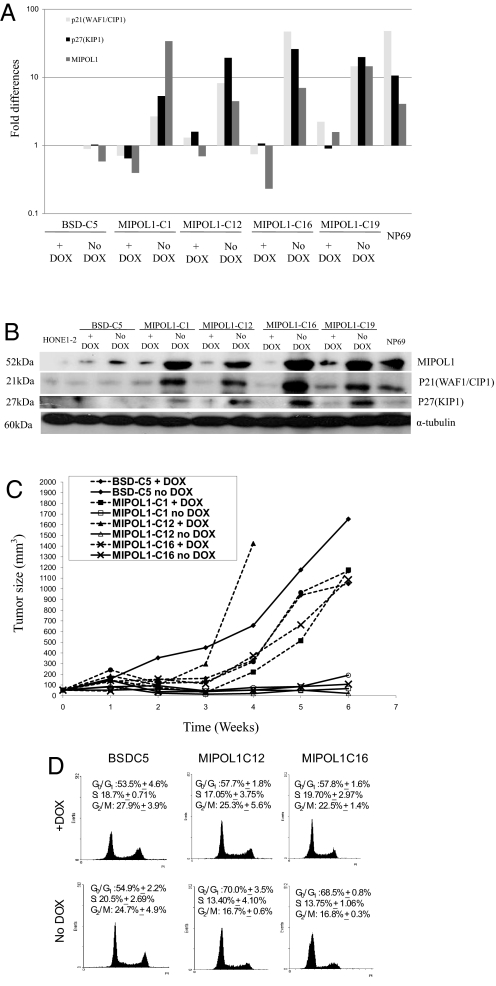
Chromosome 14 allelic loss is common in nasopharyngeal carcinoma (NPC) and may reflect essential tumor suppressor gene loss in tumorigenesis. An intact chromosome 14 was transferred to an NPC cell line using a microcell-mediated chromosome transfer approach. Microcell hybrids (MCHs) containing intact exogenously transferred chromosome 14 were tumor suppressive in athymic mice, demonstrating that intact chromosome 14 NPC MCHs are able to suppress tumor growth in mice. Comparative analysis of these MCHs and their derived tumor segregants identified 4 commonly eliminated tumor-suppressive CRs. Here we provide functional evidence that a gene, Mirror-Image POLydactyly 1 (MIPOL1), which maps within a single 14q13.1-13.3 CR and that hitherto has been reported to be associated only with a developmental disorder, specifically suppresses in vivo tumor formation. MIPOL1 gene expression is down-regulated in all NPC cell lines and in approximately 63% of NPC tumors via promoter hypermethylation and allelic loss. SLC25A21 and FOXA1, 2 neighboring genes mapping to this region, did not show this frequent down-regulated gene expression or promoter hypermethylation, precluding possible global methylation effects and providing further evidence that MIPOL1 plays a unique role in NPC. The protein localizes mainly to the nucleus. Re-expression of MIPOL1 in the stable transfectants induces cell cycle arrest. MIPOL1 tumor suppression is related to up-regulation of the p21(WAF1/CIP1) and p27(KIP1) protein pathways. This study provides compelling evidence that chromosome 14 harbors tumor suppressor genes associated with NPC and that a candidate gene, MIPOL1, is associated with tumor development.


Conflict of interest statement

The authors declare no conflict of interest.

Figures

Fig. 1.
Fig. 1.
Chromosome 14 microsatellite typing and tumorigenicity studies. (A) Microsatellite typing analysis of 5 MCH cell lines (14-E, -F, -M, -T, and -U) and their corresponding TSs. A total of 22 microsatellite markers were used. The donor MCH-D14-C2 (D), recipient cell line HONE1 (H), presence (open circles), absence (filled circles), and uninformative (U) status of markers and CRs are as indicated. The locations of the MIPOL1, SLC25A21, and FOXA1 genes and the RP11–460G19 and RP11–1116E12 BAC clones are shown on the left, and CRs 1–4 are shown on the right. (B) Representative microsatellite analysis of marker D14S75 for donor, HONE1, MCH-NPC-14T, and MCH-NPC-14T-TS2. An inverted open triangle designates the exogenous donor allele transfer, and an inverted filled triangle indicates the loss of an allele in MCH-NPC-14T-TS2, respectively. (C) In vivo tumorigenicity assay of the recipient NPC cell line, HONE1, 5 chromosome 14 MCHs (MCH-NPC-14-E, -F, -M, -T, and -U) and MCH-NPC-14E-TS10, -14T-TS2, and -14U-TS1. The curves represent an average tumor volume of all sites inoculated for each cell population. Statistically significant differences in tumor growth were observed for HONE1 compared with 5 MCHs and their TSs.
Fig. 2.
Fig. 2.
Expression levels of MIPOL1 in MCHs, TSs, NPC cell lines, and NPC tissues. (A) Q-PCR analysis of MIPOL1 expression in MCHs and their corresponding TS cell lines. The immortalized NP cell line, NP69, was used as a control for normal MIPOL1 expression. Fold changes of MIPOL1 expression were compared with HONE1 for 5 MCH cell lines and their corresponding TS cell lines. (B) Q-PCR analysis of MIPOL1 expression in 7 NPC cell lines. The fold changes of NPC cell lines were compared with the immortalized NP cell line, NP69. (C) MIPOL1 protein expression levels in the donor cell line (MCH-D14-C2), recipient cell line (HONE1), MCHs, TSs, and NPC cell lines. α-Tubulin was used for normalization in the Western blots. (D) Q-PCR analysis of 60 pairs of NPC biopsy specimens. Fold changes of MIPOL1 expression in each tumor tissue were compared with the matched nontumor tissue.
Fig. 3.
Fig. 3.
Mechanisms inducing MIPOL1 down-regulation. (A) Location of MIPOL1 promoter region (positions −537 to +194), BGS primers amplicon (positions −483 to +63), and MSP primers amplicon (positions −456 to −324) are shown. BGS analysis of the MIPOL1 promoter region in the MIPOL1 down-regulated cell lines HONE1 and HK1 and in the MIPOL1-expressing cell line, NP69. Unmethylation (open circles) and methylation (filled circles) status of CpG sites are as indicated. The location of the MSP amplicon is indicated. (B) MSP analysis of the MIPOL1 promoter region. We analyzed 7 NPC cell lines and 4 pairs of NPC patient biopsies that show MIPOL1 down-regulation. The MCH-D14-C2 and NP69 MIPOL1-expressing cell lines were used as unmethylated controls. Sizes of the PCR amplicons are shown on the right. Methylation (M) and unmethylation (U) of allele are as indicated. (C) Re-expression of MIPOL1 in all NPC cell lines after 5 μM 5-aza-2′-deoxycytidine treatment. The expression levels of MIPOL1 were determined by Q-PCR. The fold changes were compared with the untreated cell lines. (D) We used 12 microsatellite markers for LOH study of 3 cell lines (HONE1, CNE1, and NP69) and 3 NPC patient biopsies (T71, 81, and 82). The MIPOL1 promoter is unmethylated in the CNE1 cell line. We investigated 3 NPC tissues showing down-regulation of MIPOL1. NP69 was used as control. The presence (white circles), absence (black circles), not determined (gray circles), homozygous pattern (black circles with “1” in the center), and heterozygous pattern (gray circles with “2” in the center) status of markers are as indicated.
Fig. 4.
Fig. 4.
Analysis of MIPOL1 stable transfectants. (A) Q-PCR analysis of MIPOL1, p21(WAF1/CIP1) and p27(KIP1) in MIPOL1 stable transfectants (MIPOL1-C1, -C12, -C16 and -C19) and vector-alone control (BSD-C5) (±dox). Fold changes of MIPOL1 expression in each cell line were compared with the BSD-C5 (+dox) control. NP69 was used as a control for normal MIPOL1 expression. (B) Western blot analysis of MIPOL1, p21(WAF1/CIP1), and p27(KIP1) proteins in the MIPOL1 stable transfectants and vector-alone controls (±dox). α-Tubulin was used for normalization in the Western blots. (C) In vivo tumorigenicity assay of MIPOL1 stable transfectants and vector-alone controls (±dox). The curves represent an average tumor volume of all sites inoculated for each cell population. Differences observed between the MIPOL1-expressing clones, vector alone, and their corresponding +dox controls are statistically significant. (D) Representative FACSorting analysis of propidium iodide-stained BSD-C5 and MIPOL1-C12 and -C16 clones. The average percentage of cells in G0-G1, S, and G2-M phases is shown.

References

    1. Lo KW, et al. High resolution allelotype of microdissected primary nasopharyngeal carcinoma. Cancer Res. 2000;60(13):3348–3353. - PubMed
    1. Shao J, et al. High frequency loss of heterozygosity on the long arms of chromosomes 13 and 14 in nasopharyngeal carcinoma in Southern China. Chinese Medical Journal. 2002;115(4):571–575. - PubMed
    1. Mutirangura A, Pornthanakasem W, Sriuranpong V, Supiyaphun P, Voravud N. Loss of heterozygosity on chromosome 14 in nasopharyngeal carcinoma. Int J Cancer. 1998;78(2):153–156. - PubMed
    1. Yoshimoto T, et al. High-resolution analysis of DNA copy number alterations and gene expression in renal clear cell carcinoma. J Pathol. 2007;213(4):392–401. - PubMed
    1. Hu J, et al. High-resolution genome-wide allelotype analysis identifies loss of chromosome 14q as a recurrent genetic alteration in astrocytic tumours. Br J Cancer. 2002;87(2):218–224. - PMC - PubMed

Publication types

MeSH terms

Substances