. 2009 Aug 25;106(34):14484-9.
doi: 10.1073/pnas.0901528106. Epub 2009 Aug 10.

Organization of the autoantibody repertoire in healthy newborns and adults revealed by system level informatics of antigen microarray data

Affiliations

Organization of the autoantibody repertoire in healthy newborns and adults revealed by system level informatics of antigen microarray data

Asaf Madi et al. Proc Natl Acad Sci U S A. .

Abstract

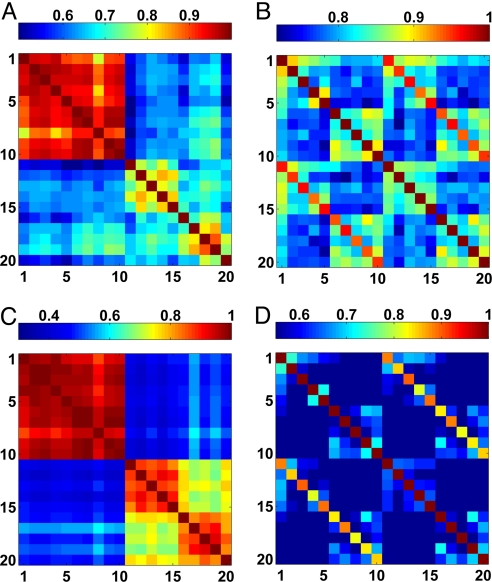
The immune system is essential to body defense and maintenance. Specific antibodies to foreign invaders function in body defense, and it has been suggested that autoantibodies binding to self molecules are important in body maintenance. Recently, the autoantibody repertoires in the bloods of healthy mothers and their newborns were studied using an antigen microarray containing hundreds of self molecules. It was found that the mothers expressed diverse repertoires for both IgG and IgM autoantibodies. Each newborn shares with its mother a similar repertoire of IgG antibodies, which cross the placental but its IgM repertoire is more similar to those of other newborns. Here, we took a system-level approach and analyzed the correlations between autoantibody reactivities of the previous data and extended the study to new data from newborns at birth and a week later, and from healthy young women. For the young women, we found modular organization of both IgG and IgM isotypes into antigen cliques-subgroups of highly correlated antigen reactivities. In contrast, the newborns were found to share a universal congenital IgM profile with no modular organization. Moreover, the IgG autoantibodies of the newborns manifested buds of the mothers' antigen cliques, but they were noticeably less structured. These findings suggest that the natural autoantibody repertoire of humans shows relatively little organization at birth, but, by young adulthood, it becomes sorted out into a modular organization of subgroups (cliques) of correlated antigens. These features revealed by antigen microarrays can be used to define personal states of autoantibody organizational motifs.


Conflict of interest statement

The authors declare no conflict of interest.

Figures

Fig. 1.
Fig. 1.
The ordered (by the dendrogram algorithm) antibody reactivity matrices. The results show the reactivities of 305 antigens of the IgM and IgG isotypes for samples taken from the 10 mother-cord pairs. The colors (green low to red high) indicate the reactivity levels. The similarity distances calculated by the dendrogram clustering algorithm for the subjects and antibodies are indicated by the blue trees in the x and y directions, respectively. (A) The ordered reactivity matrix of the IgM isotype. Note that in this matrix the cords (subjects 1–10) and the mothers (subjects 11–20) form two groups. The dendrogram distance trees show high similarity between the cords and lower (longer dendrogram distances) between the mothers. (B) Dendrogram reactivity matrix of the IgG isotypes. Note that each mother-cord pair forms a separate group.
Fig. 2.
Fig. 2.
The subject correlation matrices in color code representation. (A and B) The subject correlation matrices for the IgM and IgG isotypes, respectively. (C and D) The corresponding normalized matrices using the method described in the text. The matrices are ordered according to the cords (–10) and the mothers (–20). We note that the seeming separation of the mothers into two subgroups (the two subclusters in the mothers cluster in Fig. 2C, for mothers 1–5 and 6–10) appear to the eye more substantial because of the color code; the cross correlations between the two subgroups are ≈0.7 and they reflect experimental variations in storage and between microarrays which do not affect the results of the analysis.
Fig. 3.
Fig. 3.
Holographic representation of the immune states for the IgM isotype (Left) and IgG isotype (Right). (A) The subject holographic network in the PCA space for IgM antibodies of the 10 pairs of mothers (red) and their cord samples (blue). Each mother-cord pair is linked with color coded line (blue low to red high) according to the values of the correlation between them (Fig. 2A). (B) The same as A for the IgG isotype. (C) The IgM holographic network including the 10 mother-cord pairs, the additional 5 females (green) and the additional 8 newborns at day 1 (yellow). (D) The IgG network including the 10 mother-cord pairs and the 8 newborns at day 1 (yellow) and day 7 (cyan).
Fig. 4.
Fig. 4.
The antigen cliques. (A) The normalized antigen correlation matrix of the IgM isotype of 45 antigens that compose the strong cliques in the maternal dataset. (B) Similar to A but for the IgG data. Note that in this case 57 antigens were selected and the IgM and IgG antigen clique members do not have to be similar. (C and D) The corresponding antigen networks. Note that 4 and 3 subgroups were identified for the IgM and IgG isotypes, respectively. In the presentation of the antigen networks, nodes (antigens) with high correlations (>0.85) are linked with color coded lines according to the correlation levels.
Fig. 5.
Fig. 5.
The reactivity profile of the antigens of a specific clique. The normalized reactivity values (relative to the average and divided by the STD) for the 10 mothers (marked 1–10) of the 22 antigens that belong to a specific IgM clique (the green cluster in Fig. 4C). For clarity, each antigen is colored with a different color. The black boxes mark the clique profile or representative clique reactivities—the averages of the reactivities of the clique's antigens for each individual.
Fig. 6.
Fig. 6.
IH: The cord antigen networks in the PCA space. (A) The antigen network for the large cluster of 150 antigens identified for the cords' IgM isotype. (B) The antigen network of the 132 antigens that form subgroups for the IgG isotype. For both networks, nodes (antigens) with high correlations (>0.85) are linked with color coded lines according to the correlation levels.
Fig. 7.
Fig. 7.
Comparing congenital and mature immune organization. (A) The antigens of the maternal IgG cliques, presented according to their correlations in the cords dataset (compare with Fig. 4B, where the same antigens are presented according to their correlations in the maternal dataset). The color code of the cliques is the same as in Fig. 4B and the links between the antigens are for correlations (computed for the cords dataset) >0.85. (B) Combined presentation. The same antigens are presented according to both the maternal correlations (circles) and the cords correlations (asterisks) in the maternal PCA space. Nodes with correlations >0.85 are linked. The organization of the maternal antigen network is weakly detected in the cords' antigen network.

References

    1. Janeway CA, Travers P. Immunobiology: The Immune System in Health and Disease. New York: Garland Science; 2005.
    1. Cohen IR. Tending Adam's Garden: Evolving the Cognitive Immune Self. London: Elsevier Academic; 2000.
    1. Cohen IR. The cognitive paradigm and the immunological homunculus. Immunol Today. 1992;13:490–494. - PubMed
    1. Cohen IR. Discrimination and dialogue in the immune system. Semin Immunol. 2000;12:215–219. - PubMed
    1. Perelson AS, Weisbuch G. Theoretical and Experimental Insights into Immunology. New York: Springer-Verlag; 1992.

Publication types

LinkOut - more resources