

Regional rates of neocortical atrophy from normal aging to early Alzheimer disease
- PMID: 19667321
- PMCID: PMC2727145
- DOI: 10.1212/WNL.0b013e3181b16431
Regional rates of neocortical atrophy from normal aging to early Alzheimer disease
Abstract
Objective: To evaluate the spatial pattern and regional rates of neocortical atrophy from normal aging to early Alzheimer disease (AD).
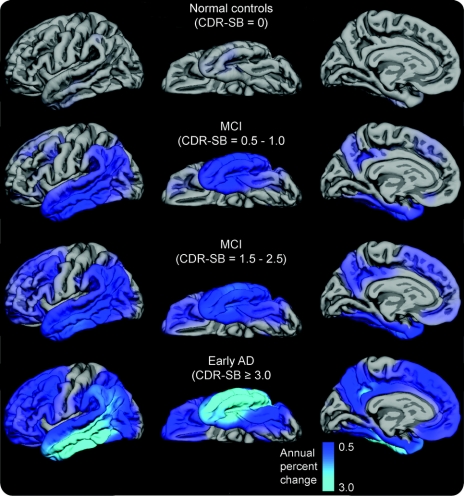
Methods: Longitudinal MRI data were analyzed using high-throughput image analysis procedures for 472 individuals diagnosed as normal, mild cognitive impairment (MCI), or AD. Participants were divided into 4 groups based on Clinical Dementia Rating Sum of Boxes score (CDR-SB). Annual atrophy rates were derived by calculating percent cortical volume loss between baseline and 12-month scans. Repeated-measures analyses of covariance were used to evaluate group differences in atrophy rates across regions as a function of impairment. Planned comparisons were used to evaluate the change in atrophy rates across levels of disease severity.
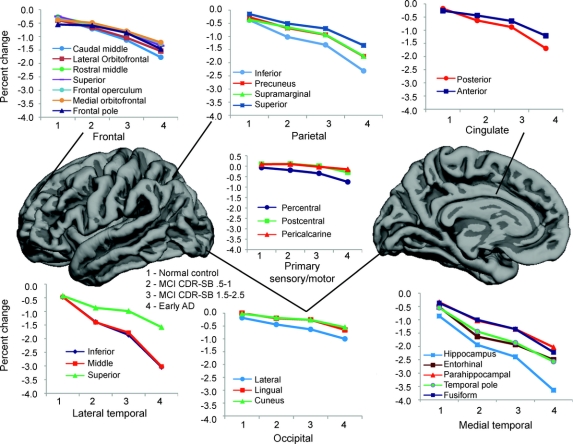
Results: In patients with MCI-CDR-SB 0.5-1, annual atrophy rates were greatest in medial temporal, middle and inferior lateral temporal, inferior parietal, and posterior cingulate. With increased impairment (MCI-CDR-SB 1.5-2.5), atrophy spread to parietal, frontal, and lateral occipital cortex, followed by anterior cingulate cortex. Analysis of regional trajectories revealed increasing rates of atrophy across all neocortical regions with clinical impairment. However, increases in atrophy rates were greater in early disease within medial temporal cortex, whereas increases in atrophy rates were greater at later stages in prefrontal, parietal, posterior temporal, parietal, and cingulate cortex.
Conclusions: Atrophy is not uniform across regions, nor does it follow a linear trajectory. Knowledge of the spatial pattern and rate of decline across the spectrum from normal aging to Alzheimer disease can provide valuable information for detecting early disease and monitoring treatment effects at different stages of disease progression.
Figures
References
-
- Sluimer JD, van der Flier WM, Karas GB, et al. Whole-brain atrophy rate and cognitive decline: longitudinal MR study of memory clinic patients. Radiology 2008;248:590–598. - PubMed
-
- Fox NC, Freeborough PA. Brain atrophy progression measured from registered serial MRI: validation and application to Alzheimer’s disease. J Magn Reson Imaging 1997;7:1069–1075. - PubMed
-
- Chan D, Janssen JC, Whitwell JL, et al. Change in rates of cerebral atrophy over time in early-onset Alzheimer’s disease: longitudinal MRI study. Lancet 2003;362:1121–1122. - PubMed
Publication types
MeSH terms
Grants and funding
- NS056091/NS/NINDS NIH HHS/United States
- R01 MH079752/MH/NIMH NIH HHS/United States
- U19 AG010483/AG/NIA NIH HHS/United States
- MH079146-01A2/MH/NIMH NIH HHS/United States
- U01 AG024904/AG/NIA NIH HHS/United States
- 1R43NS061023/NS/NINDS NIH HHS/United States
- U24 RR019701/RR/NCRR NIH HHS/United States
- R01 AG031224/AG/NIA NIH HHS/United States
- U54 NS056883-01/NS/NINDS NIH HHS/United States
- 5K01MH079146-02/MH/NIMH NIH HHS/United States
- N01 MH22005/MH/NIMH NIH HHS/United States
- R01 AG024506/AG/NIA NIH HHS/United States
- 2P50NS022343-21A2/NS/NINDS NIH HHS/United States
- K23 NS050305/NS/NINDS NIH HHS/United States
- K01 AG029218/AG/NIA NIH HHS/United States
- 7R01AG022381-03/AG/NIA NIH HHS/United States
- U24 RR021382/RR/NCRR NIH HHS/United States
- 5R43NS061023/NS/NINDS NIH HHS/United States
- U24 RR021992/RR/NCRR NIH HHS/United States
- 2 R01 NS18741-23A1/NS/NINDS NIH HHS/United States
- R01AG031224/AG/NIA NIH HHS/United States
- U24 RR21382/RR/NCRR NIH HHS/United States
- 1U01AG024904-02/AG/NIA NIH HHS/United States
- 5 U24 RR021382-04/RR/NCRR NIH HHS/United States
- 1P50MH081755-01/MH/NIMH NIH HHS/United States
- 1R01AG031224/AG/NIA NIH HHS/United States
- P30 MH062512/MH/NIMH NIH HHS/United States
- 1R01MH079752-01/MH/NIMH NIH HHS/United States
- 2R01 NS018741-23A1/NS/NINDS NIH HHS/United States
LinkOut - more resources
Full Text Sources
Medical