Comparative Study
. 2009 Sep;97(3):195-205.
doi: 10.1097/HP.0b013e3181a9bd42.

Characterization of a 137Cs irradiator from a new perspective with modern dosimetric tools

Affiliations
Comparative Study

Characterization of a 137Cs irradiator from a new perspective with modern dosimetric tools

Samuel L Brady et al. Health Phys. 2009 Sep.

Abstract

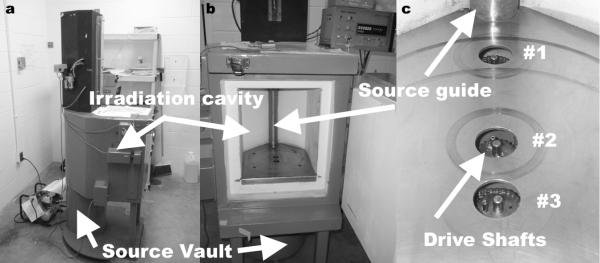
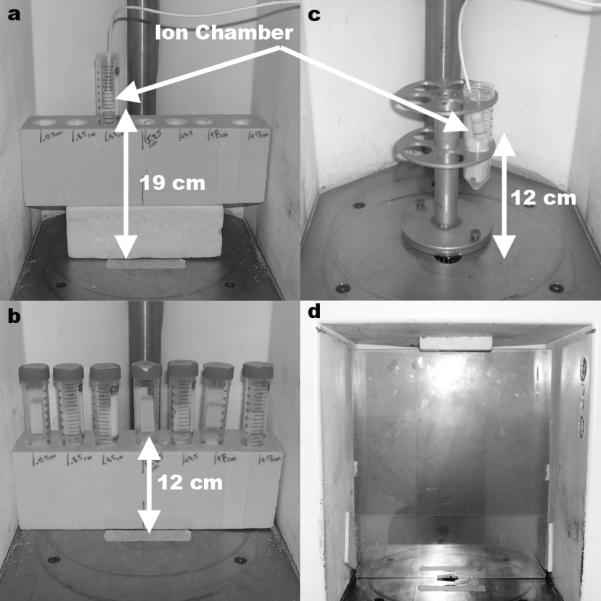
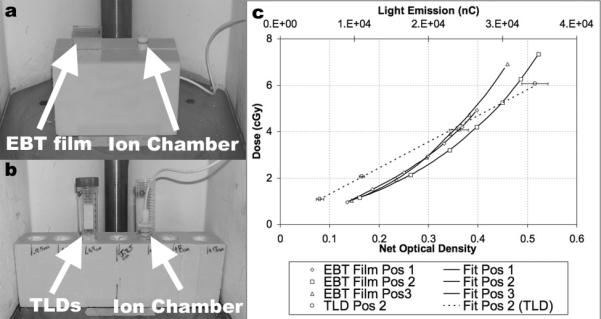
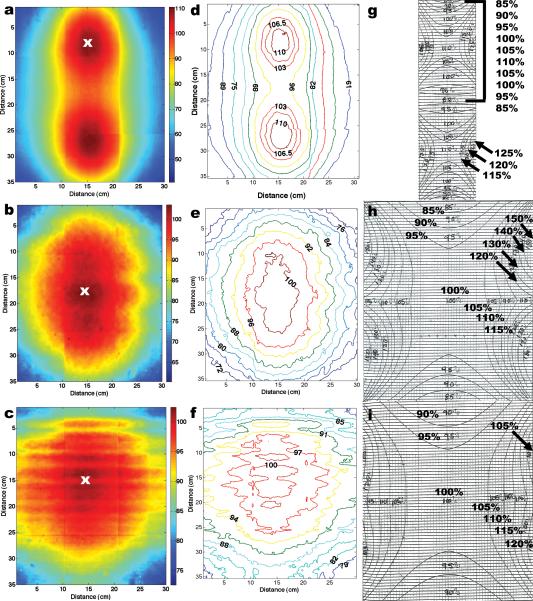
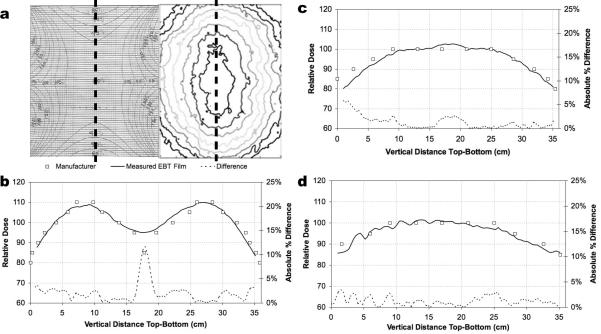
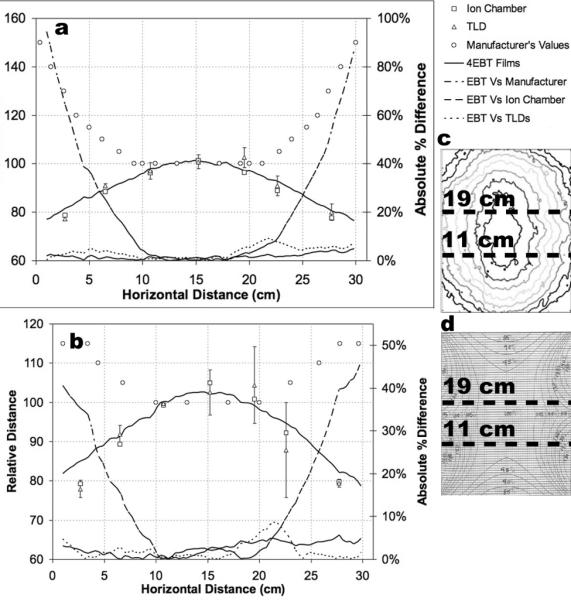
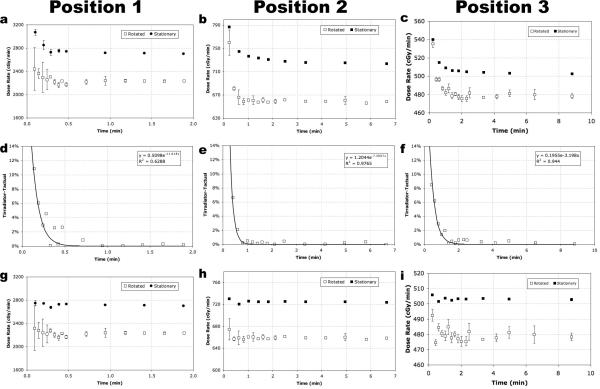
To provide for accurate dosimetry in a 137Cs irradiator, the following were investigated: (1) correct mapping of the irradiator cavity's dose distribution, (2) rotated versus stationary dose rate measurements, (3) exposure-to-dose calibration selection for exposure time calculation, and (4) irradiator-timer error correction. This work introduces techniques to map dose distributions and measure dose rates with new high-sensitivity radiochromic films and a small-volume ion chamber constructed for in-beam, high-intensity gamma irradiation. Measured film distributions were compared to manufacturer-provided data and independent measurements from an ion chamber and TLD-100 chips. Measured film distributions agreed with the manufacturer-provided data in the central-vertical region, but disagreed by as much as 95% in surrounding regions. The independent measurements agreed within 96% with the measured dose distribution. Dose rates varied by approximately 11% for a rotational versus stationary setup, by approximately 10% for the dose-to-medium correction between air and soft tissue, and by approximately 4-12% for irradiation times from 0.2-0.7 min due to timer error. In conclusion, a critical irradiator characterization should be performed, initially, as a part of the acceptance testing of a newly installed irradiator, and periodically as an ongoing quality assurance protocol. We investigated, and recommend as part of a comprehensive irradiator verification protocol, the inclusion of radiochromic film-measured dose distributions, dose rates measured during rotation when samples are likewise rotated for exposure, timer error corrections for short-time irradiation, and exposure-to-dose corrections that reflect typical sample compositions, e.g., soft tissue or air.


Figures

Fig. 1
Fig. 1
The Mark I-68A 137Cs irradiator is shown from the side demonstrating the location of the source vault in relationship to the irradiation cavity, (a). The source resides in the source vault while in the “off” position and moves up along the source guide, (b), into the “on” position to expose the irradiation cavity with gamma radiation. The manufacturer provided dose distribution mappings are delineated at three specific cross-sectional planes that correspond with three drive shafts used to rotate sample turntables, (c).
Fig. 2
Fig. 2
Two horizontal dose profiles were used to verify film results. Horizontal profiles were measured at 12 cm and 19 cm from the irradiator floor and centered over position 2. Each horizontal profile was independently measured with both an 0.18 cc ion chamber, (a), and TLD chips, (b), suspended in 50 ml plastic vials across seven locations. The dose rate measurements used a rotating vial platform and a 0.18 cc ion chamber suspended in a 50 ml plastic vial 12 cm above the irradiator floor, (c). Dose distribution mappings were measured at each position (position 2 shown) using a Plexiglas buildup plate and four EBT films, (d).
Fig. 3
Fig. 3
Calibration curve experimental setups: EBT film, (a), and TLDs, (b), required a Styrofoam block to place the dosimeters 12 cm above the irradiator floor to provide a free-in-air irradiation environment. Plexiglas buildup plates were used for film and TLD dosimeters, and dosimeters used in TLD calibration curve setup were corrected for beam attenuation due to the 50 ml plastic vials used to suspend dosimeters in air. Resulting calibration curves, (c), were developed at positions 1, 2, and 3 with net optical density to dose for films and light emission to dose for TLDs, (TLDs were only calibrated at position 2).
Fig. 4
Fig. 4
Dose distributions measured with EBT films, (a-c), were converted to isodoses, (d-f), and compared with the manufacturer-provided isodose data, (g-i). The measured dose distributions were normalized at the location marked by the “x”, in (a-c). EBT measured isodose data averaged an agreement of < 2% overall in the central-vertical axis for all three positions with the manufacturer-isodose data. However, a marked difference was observed in the gradient regions surrounding the central axis when the two sets of data were compared.
Fig. 5
Fig. 5
Vertical line profiles of the manufacturer-provided and EBT film measured data were compared along the central-vertical axis, (a), for positions 1, (b), 2 (c), and 3 (d). Relative dose difference plots showed general agreement within 95% between measured versus manufacturer data along the vertical central axis.
Fig. 6
Fig. 6
Horizontal line profiles at 11 cm (a) and 19 cm (b) from the irradiator cavity floor sampled the measured distribution (c) and the manufacturer-provided distribution (d). Horizontal line profiles compared relative film dose distributions with manufacturer-provided dose distributions along with two independent dosimeters—TLDs and an ion chamber. Dashed lines depict absolute percent difference between EBT film and the other data sets.
Fig. 7
Fig. 7
Measured dose rate values for positions 1, 2, and 3 measure an artificial rise in value do to timer error (a-c). Timer error was measured for a range of times of 0.09-8.80 min. Timer error measured the largest effect for short-time exposures (d-f). Dose rate values corrected for timer error (g-i) exhibit a consistent dose rate value over time with expected experimental fluctuation where greater experimental fluctuation is seen in the dose rate values measured during rotation. Dose rate plots represent values that have been corrected for soft tissue attenuation only.

References

    1. Ali I, Williamson JF, Costescu C, Dempsey JF. Dependence of radiochromic film response kinetics on fractionated doses. Appl Radiat Isot. 2005;62:609–17. - PubMed
    1. Attix F. Introduction to Radiological Physics and Radiation Dosimetry. WILEY-VCH. 1986
    1. Butson MJ, Cheung T, Yu PK. Absorption spectra variations of EBT radiochromic film from radiation exposure. Phys Med Biol. 2005;50:N135–N140. - PubMed
    1. Butson MJ, Cheung T, Yu PK. Weak energy dependence of EBT gafchromic film dose response in the 50kVp-10MVp range. Appl Radiat Isot. 2005;64:60–62. - PubMed
    1. Cheung T, Butson MJ, Yu PK. Post-irradiation colouration of Gafchromic EBT radiochromic film. Phys Med Biol. 2005;50:N281–5. - PubMed

Publication types

MeSH terms

Substances