. 2009 Sep;12(9):1159-64.
doi: 10.1038/nn.2353. Epub 2009 Aug 9.

High-sensitivity rod photoreceptor input to the blue-yellow color opponent pathway in macaque retina

Affiliations

High-sensitivity rod photoreceptor input to the blue-yellow color opponent pathway in macaque retina

Greg D Field et al. Nat Neurosci. 2009 Sep.

Abstract

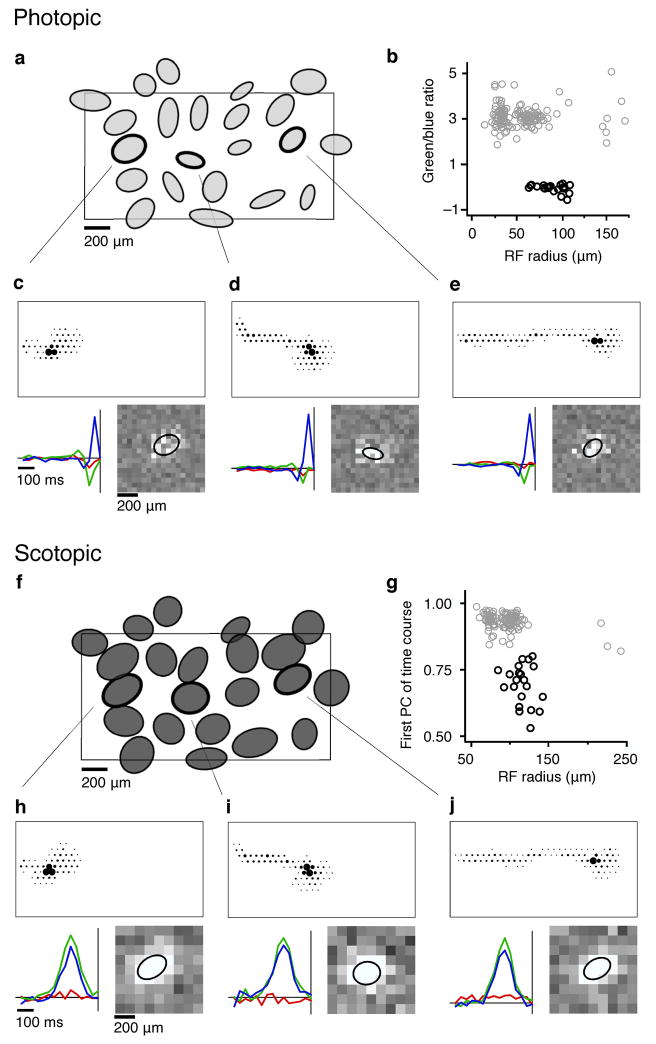
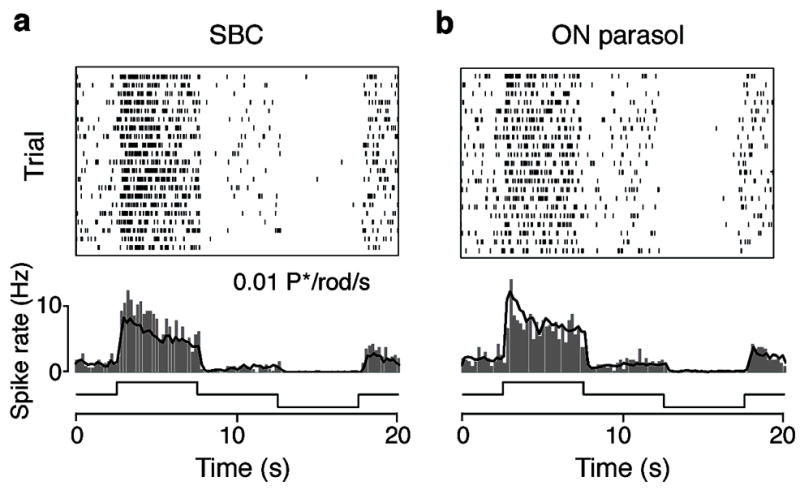
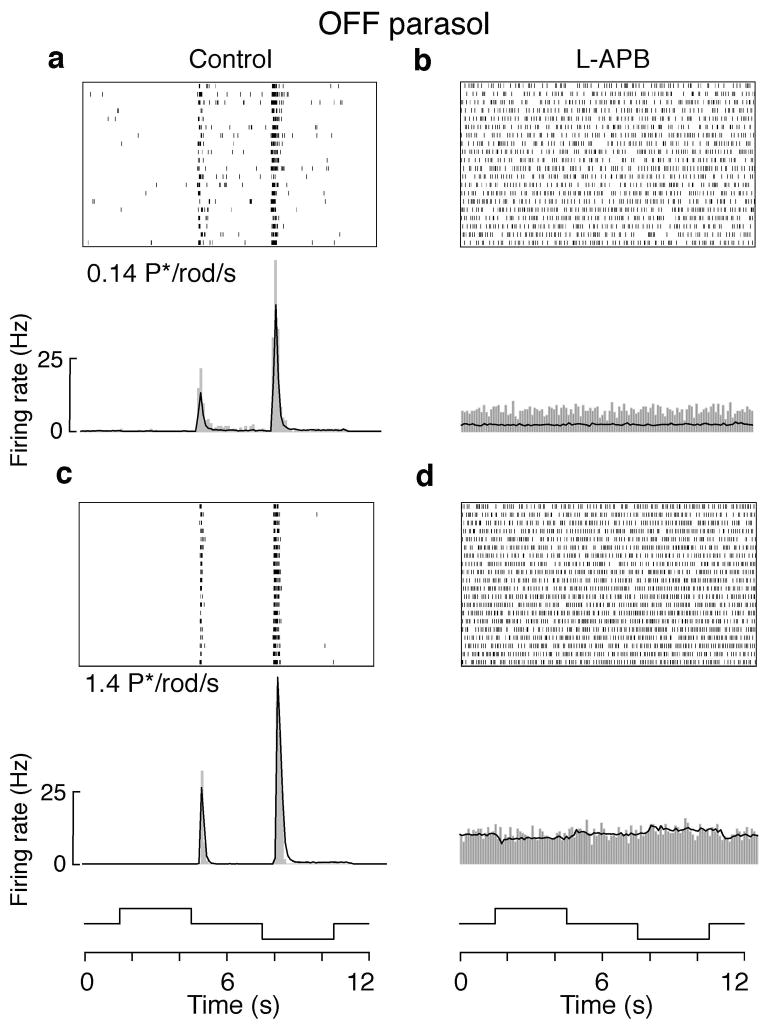
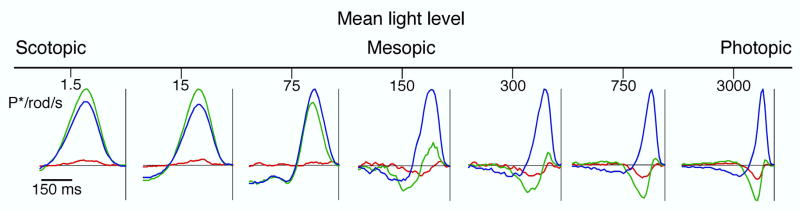
Small bistratified cells (SBCs) in the primate retina carry a major blue-yellow opponent signal to the brain. We found that SBCs also carry signals from rod photoreceptors, with the same sign as S cone input. SBCs exhibited robust responses under low scotopic conditions. Physiological and anatomical experiments indicated that this rod input arose from the AII amacrine cell-mediated rod pathway. Rod and cone signals were both present in SBCs at mesopic light levels. These findings have three implications. First, more retinal circuits may multiplex rod and cone signals than were previously thought to, efficiently exploiting the limited number of optic nerve fibers. Second, signals from AII amacrine cells may diverge to most or all of the approximately 20 retinal ganglion cell types in the peripheral primate retina. Third, rod input to SBCs may be the substrate for behavioral biases toward perception of blue at mesopic light levels.


Figures

Figure 1
Figure 1
SBC identification at photopic and scotopic light levels (a) Spatial receptive fields of 22 simultaneously recorded SBCs at <800 (see Methods) P*/cone/s. Ellipses represent the 1 s.d. contour of a fit to the blue-ON receptive field (see Methods). Rectangle indicates the outline of the electrode array (1800 × 900 μm). (b) Scatter plot shows the classification of SBCs (black circles) that distinguishes them from all other ON RGCs (gray circles, see Methods) (ce), Three cells are highlighted from the receptive field mosaic in a. Top: the electrophysiological image (EI; see Methods). Lower left: STA time course for each display primary: red, green and blue. The abscissa indicates the time to the spike, the ordinate indicates the primary intensities relative to background (arbitrary units: a.u.). Bottom right: spatial profile of the STAs from the blue primary; ellipse is 1 s.d. contour from fit. (f) Spatial receptive fields of the cells in a estimated at 1.2 P*/rod/s. (g) Scatter plot shows the classification of SBCs at the low light level (black circles, see Methods). (h–j) The EIs (top) and STA time courses and spatial profiles (bottom) measured at the low light level for the same cells as c–e. Spatial profiles are from the sum of the blue and green primaries.
Figure 2
Figure 2
Change in SBC receptive field size between scotopic and photopic light levels. (a) Overlaid rod mediated (dark gray) and S cone mediated (light gray) receptive fields from four recordings. Retina 1 is the same as that in Fig. 1. The rod mediated receptive fields for retinas 1–3 were measured at 1.2 P*/rod/s, and those for retina 4 were measured at 0.077 P*/rod/s. Rectangles indicate the outline of the electrode array. (b) Comparison of receptive field size (radius of circle with area equal to ellipse) between rod and cone dominated conditions in a single preparation. (c) Comparison of receptive field radius across 8 preparations. Circles and squares display preparations where the scotopic light level was 1.2 and 0.077 Rh*/rod/s respectively. Triangles represent preparations in which the pigment epithelium remained attached to the retina (see Methods) and the scotopic light level was 1.5 P*/rod/s. Error bars are 1 s.d. (d) Receptive field size was averaged across 17 (filled circles) and 15 (open circles) SBCs in two preparations with the pigment epithelium attached to the retina. The light level was transitioned from cone (<1000 P*/cone/s), to rod (1.5 P*/rod/s), and back to cone light levels. Error bars are ±1 s.e.m.
Figure 3
Figure 3
Responses of SBCs and ON parasol cells to dim light steps. (a) Top: spike rasters from a single SBC in response to 20 repetitions of full field light steps that transitioned every 5 s from gray (0.01 P*/rod/s), to white (0.02 P*/rod/s), to gray, to nominal black (0.00008 P*/rod/s). Middle: peri-stimulus time histrogram (PSTH; bin size = 0.2 s) of the response of an individual SBC (gray bars) and the average from 6 simultaneously recorded SBCs (black trace). Bottom: time course of the stimulus. (b) Top: spike raster from a single ON parasol cell recorded simultaneously with the SBC in a. Middle: PSTH of the ON parasol cell (gray bars) and average from 23 ON parasol cells recorded simultaneously. Bottom: time course of stimulus.
Figure 4
Figure 4
L-APB nearly eliminated the light response in OFF parasol cells at low scotopic conditions. (a) Top: spike rasters from a single OFF parasol cell in response to 20 repetitions of full field light steps that transitioned every 3 s from gray (0.14 P*/rod/s), to white (0.28 P*/rod/s), to gray, to nominal black (0.0005 P*/rod/s). Bottom: PSTH (bin size = 0.1 s) of the OFF parasol cell (gray bars) and the average from 24 simultaneously recorded OFF parasol cells (black trace). (b) Same individual cell and population of cells as in a, with bath application of 10μM L-APB. (c) Same individual and population of cells as in a, stimulated at light levels 10 fold higher: gray = 1.4 P*/rod/s, white = 2.8 P*/rod/s, black = 0.005 P*/rod/s. (d) Same as c with 10 μM L-APB.
Figure 5
Figure 5
Gap junctions are present at appositions between AII amacrine and S cone bipolar cells. (a) A stack of 5 optical sections of triple labeled macaque retina containing: 2 S cone bipolar cells labeled with anti-G6-gly (green), 4 AII amacrine cells labeled with anti-calretinin (blue) and numerous connexin 36-immunoreactive puncta (red). The large arrow indicates the perikaryon of the S cone bipolar cell. Note the characteristic, laterally oriented dendrites in the outer plexiform layer and the axon descending to S5 of the IPL. The small arrowheads indicate the strata containing labeled amacrine cell dendrites. One of the labeled S cone bipolar cell axon terminals contacts an AII amacrine cell dendrite, and a labeled punctum is present at the site (square). (b–e) Consecutive single optical sections of the region indicated by the square in a are shown at higher magnification. Arrowheads in b–e identify the contact location. OPL: outer plexiform layer; INL: inner nuclear layer; IPL: inner plexiform layer.
Figure 6
Figure 6
Spectral tuning of SBC responses depended on light level. In a single recording containing 33 SBCs, the mean STA time courses of the SBCs for the red, green and blue display primaries are shown at seven light levels. The light level increases from left to right. At 3000 P*/rod/s, the rods were saturated, and the response was mediated by the cones. Photoisomerization rates for the L, M and S cones were 1400, 1200, and 430 P*/cone/s, respectively. The SBCs displayed color opponency; increments in the blue display primary and decrements in the red and green display primaries tended to precede spikes. At 150 P*/rod/s, the spectral tuning of the SBCs exhibited a marked change; the SBCs continued to display color opponent responses, but increments rather than decrements in the green display primary tended to precede spikes. At 1.5 P*/rod/s, the light level was below cone threshold, and the spectral tuning of the response was non-opponent reflecting pure rod input to the SBCs.

References

    1. Masland R. The fundamental plan of the retina. Nat Neurosci. 2001;4:877–886. - PubMed
    1. Dacey D. Origins of perception: retinal ganglion cell diversity and the creation of parallel visual pathways. In: Gazzaniga M, editor. The Cognitive Neurosciences. MIT Press; 2004. pp. 281–301.
    1. Field G, Chichilnisky E. Information processing in the primate retina: circuitry and coding. Annu Rev Neurosci. 2007;30:1–30. - PubMed
    1. Dacey D, Lee B. The ’blue-on’ opponent pathway in primate retina originates from a distinct bistratified ganglion cell type. Nature. 1994;367:731–735. - PubMed
    1. Szmajda B, Grunert U, Martin P. Retinal ganglion cell inputs to the koniocellular pathway. J Comp Neurol. 2008;510:251–268. - PubMed

Publication types

MeSH terms

Substances