. 2009 Sep;41(9):968-76.
doi: 10.1038/ng.428. Epub 2009 Aug 9.

Differentiation stage determines potential of hematopoietic cells for reprogramming into induced pluripotent stem cells

Affiliations

Differentiation stage determines potential of hematopoietic cells for reprogramming into induced pluripotent stem cells

Sarah Eminli et al. Nat Genet. 2009 Sep.

Abstract

The reprogramming of somatic cells into induced pluripotent stem (iPS) cells upon overexpression of the transcription factors Oct4, Sox2, Klf4 and cMyc is inefficient. It has been assumed that the somatic differentiation state provides a barrier for efficient reprogramming; however, direct evidence for this notion is lacking. Here, we tested the potential of mouse hematopoietic cells at different stages of differentiation to be reprogrammed into iPS cells. We show that hematopoietic stem and progenitor cells give rise to iPS cells up to 300 times more efficiently than terminally differentiated B and T cells do, yielding reprogramming efficiencies of up to 28%. Our data provide evidence that the differentiation stage of the starting cell has a critical influence on the efficiency of reprogramming into iPS cells. Moreover, we identify hematopoietic progenitors as an attractive cell type for applications of iPS cell technology in research and therapy.


Figures
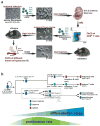
Figure 1
Figure 1. Development of a transgenic system for inducible expression of Oct4, Sox2, Klf4 and cMyc in the murine hematopoietic system
(a) Strategy used to reprogram different cell types of the hematopoetic system. Tail tip fibroblasts heterozygous for the ROSA26-M2rtTA and Oct4-GFP knock-in alleles were infected with four different doxcycline (dox) inducible lentiviruses encoding Oct4, Sox2, Klf4 and cMyc. Resulting primary (1°) iPS cells were injected into murine blastocytes and fetal liver was isolated from E14.5 embryos, in vitro differentiated (IVD) by stromal co-culture and sorted for emerging CD8 positive (+) T cells by fluorescent-activated cell sorting (FACS). CD8+ T cells were optionally superinfected with the four dox-inducible lentiviruses to ensure strongest possible transgene expression and subsequently cultured on dox for 12 days. Resulting secondary (2°) iPS cells were labeled with a lentivirus constitutively expressing tdTomato and injected into blastocytes to generate adult chimeras. tdTomato+ hematopoietic cells at different stages of differentiation (see Figure 1B) were isolated by FACS from spleen, thymus and bone marrow (BM), induced with dox and resulting tertiary (3°) iPS cell lines were used for molecular and functional analyses including rearrangement and pluripotency assays. (b) Scheme of hematopoiesis with emphasis on the cell populations used in this study. Blue triangle indicates progressive differentiation from LT-HSCs over progenitors to terminally differentiated cells. Green curve illustrates proliferation rate, which is highest in progenitors and lowest in quiescent LT-HSCs and most terminally differentiated cells. LT-HSCs, long-term hematopoietic stem cells; MPs, myeloid progenitors (consisting of CMP, common myeloid progenitors, MEP, megakaryocyte/erythrocyte progenitors and GMPs, granulocyte/macrophage progenitors); CLP, common lymphoid progenitors. Surface markers used for FACS purification are displayed in italic script in brackets, LK+S+, lin c-Kit+Sca-1+.
Figure 2
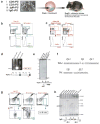
Figure 2. Generation and characterization of iPS cells derived from mature B and T lymphocytes by four factors
(a) Sorting strategy of tdTomato+ (gate not shown) mature CD3+ splenic T lymphocytes, immature IgM+ and mature IgMlow IgDhigh B lymphocytes from 10 week-old CD8-iPS chimeras by FACS. (b) ES-like morphology of tdTomato+ Oct4-GFP+ iPS colonies derived from mature B and T cells. (c) (top) Viable newborn chimeras derived from CD3-iPS and IgD-iPS cell lines show red fluorescence originating from the labeled iPS cell lines. Shown are tdTomato+ chimeric pups and non-chimeric littermates (marked by asterisks) under regular light (left) and UV light (right). (bottom) Adult chimeras derived from CD3-T iPS, IgM-B and IgD-B cell iPS show obvious coat color chimerism.
Figure 3
Figure 3. Monoclonal immune system in Rag2−/− chimeras produced with lymphocyte-derived iPS cells
(a) Scheme of Rag2 complementation assay to produce chimeras whose lymphoid compartment is entirely derived from iPS cells. (b) Expression of the Vβ4.1 T cell receptor (TCR) on the majority of CD3+ cells derived from CD8-iPS chimeras (90.9% compared to 7.02% in wild-type (WT) controls). C57BL/6xDBA/2 F1 (BDF1) mice served as WT controls. (c) CD3+ splenocytes from CD8-iPS chimeras almost lack TCRγδ-expressing T cells compared to WT controls (0.42 % vs 3.86 %, respectively). (d) Detection of TCRβ D-J rearrangement by PCR on DNA isolated from the CD8-iPS cell line. D-J locus and primer pair (1,7) are shown below the PCR gel. (e) (top) V-D-J-rearrangement band (marked by asterisk) at the TCRα locus as determined by Southern blot analysis of BamHI (B) digested genomic DNA isolated from CD8a-iPS cells and purified tail tip cells from CD8-iPS chimeras. DNA from V6.5 wild type ES cells and BDF1 WT tail tip cells served as controls. Probe (pA1) and fragment length are indicated on the side. (bottom) Schematic map of the TCRα locus including all relevant restriction sites, fragment length (in kilo bases, KB) and the Southern blot probe (maps not drawn to scale). (f) Sequenced joints of V-D-J and D-J rearrangements of both TCRβ alleles of the CD8-iPS cell line as determined by genomic PCR with specific primers. Single elements are underlined and labeled. Asterisks mark P/N nucleotides not encoded in the germline. Results were identical in 10 different bacterial clones. (g) Detection of Igλ and Igκ light chains on IgM+ splenocytes of IgM-iPS Rag2−/− chimeras. Most iPS cell-derived IgM+ B cells express Ig kappa light chain compared with WT control (93.6 % vs 71.6 % WT, respectively), but lack Igλ chain expression (0.5 % vs 18 % WT). Note the complete absence of IgM+ B cells in Rag2−/− control spleen. Representative graphs of 2 experiments are shown. (h) (top) Southern blot analysis on genomic DNA from different IgD-iPS cell lines to detect rearrangements at the immunoglobulin heavy chain (IgH) locus. The following enzyme/probe combinations were used: BamHI (B)/pH1 and HindIII (H)/pH2. (bottom) Schematic map of the IgH locus including all relevant restriction sites, fragment lengths, and Southern blot probes. Black bars denote JH1 to JH4 elements.
Figure 4
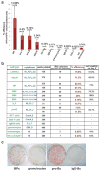
Figure 4. Reprogramming potentials of different hematopoietic cell types into iPS cells
(a) Average reprogramming efficiencies into iPS cells of different hematopoietic cell types explanted on 10cm dishes on feeder cells in the presence of ES medium supplemented with dox and cytokines. Efficiencies were determined by dividing the number of Oct4-GFP+ colonies that grew in the absence of doxycycline by the number of seeded cells (for details see material and method section). Numbers above each bar represent the mean value for that sample. Bars represent mean ± standard deviation (SD). “n” denotes the number of independent experiments for that particular cell type. Note that the progenitors from different hematopoietic lineages show higher reprogramming potentials compared with any differentiated cell type shown. See figure 1B and legend for details of cell types. (b) Reprogramming efficiencies of different cell types after single cell sorting into 96-well plates. Reprogramming efficiencies were determined by counting Oct4 GFP+ colonies at day 18, 3 days after doxycycline withdrawal. Cell viabilities of individual populations were determined by scoring uninduced cells sorted in 96-well or terasaki plates. “Macrophage I” denotes macrophages directly sorted from BM into 96-well plates while “Macrophage II” denotes macrophages arising from total BM cultures for 5 days in ES medium with M-CSF. KL, Kit-ligand; T, TPO; FL, Flt3-ligand; E, EPO; GM, GM-CSF; G, G-CSF; M, M-CSF; C, CpG; L, LPS; 3, IL-3; 6, IL-6; 7, IL-7; 11, IL-11. (c) AP staining of iPS-like colonies obtained from selected progenitors and mature cell types. Bone marrow MPs (1.5×10^3 cells per 10cm dish), proBs (2×10^3 cells per 10cm dish), granulocytes (1.5×10^3 cells per 10cm dish) and spleen IgD+ mature B cells (1×10^6 cells per 10cm dish) were plated on feeder cells in ES cell media supplemented with dox and cytokines. After 12 days, dox was removed and plates were stained for AP activity at day 14.
Figure 5
Figure 5. Effect of proliferation rate of hematopoietic cells on reprogramming potential
(a) Experimental design: HSCs, B and T cells were grown under either proliferation-inducing or – survival-promoting conditions at the time of transgene expression. The formation of iPS colonies was scored 18 days later, 3 days after doxycycline discontinuation. (b) Table summarizing the different growth factor conditions for HSCs, B and T cells, the resultant fraction of cycling cells (measured by Hoechst or PI staining) and efficiency of iPS formation. Note that reprogramming potential correlates with differentiation stage but not with proliferation rate. The TPO concentration differed in the high (20ng/ml) and low (0.5ng/ml) proliferation condition. Efficiencies of HSCs were determined by single-cell sorting into 96-wells into multiple 96-well plates. Efficiencies of B and T cells were assessed by plating 1×10^5 cells into 12-well dishes in duplicates or triplicates. KL, Kit-ligand; T, TPO; FL, Flt3-ligand; C, CpG; L, LPS; CD3, αCD3 antibody; CD28, αCD28 antibody; 3, IL-3; 6, IL-6; 7, IL-7; 11, IL-11; 15, IL-15.
Figure 6
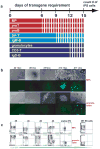
Figure 6. Transgene requirement and reprogramming kinetics in progenitors and mature cells
(a) Temporal requirement for viral transgene expression in individual cell populations undergoing reprogramming. Doxycycline was added to each cultured cell type (solid lines) and withdrawn at days 6, 9 and 12, followed by growth in regular ES cell medium (dotted lines) until day 15 when Oct4-GFP positive colonies were scored. Note that all progenitors (MPs, Pro-Ts, Pro-Bs) are transgene independent and develop into stabe iPS lines by day 6 while more committed DP-thymocytes and IgM-splenocytes become independent of transgene expression by day 9 and mature granulocytes, IgD-B cells and CD3-T cells by day 12. (b) Time course of morphological changes and Oct4-GFP expression in MPs and granulocytes undergoing reprogramming. Note appearance of weak Oct4-GFP positive cells by day 6 in MP cultures compared with day 8 in granulocytes. (c) Time course of surface marker expression and Oct4-GFP activity in MPs and granulocytes undergoing reprogramming by FACS analysis. Note that MPs reactivate Oct4-GFP sooner (day 6) than granulocytes (day 9). Oct4-GFP+ cells emerge from within the c-Kit+ population. Granulocytes gradually downregulate Gr-1 before activating Oct4-GFP within the Gr-1 population. Representative graphs of 3 experiments are shown. Numbers shown in quadrants are percentages of gated populations.

Similar articles

Cited by

References

    1. Maherali N, et al. Directly reprogrammed fibroblasts show global epigenetic remodeling and widespread tissue contribution. Cell Stem Cell. 2007;1:55–70. - PubMed
    1. Okita K, Ichisaka T, Yamanaka S. Generation of germline-competent induced pluripotent stem cells. Nature. 2007;448:313–7. - PubMed
    1. Takahashi K, Yamanaka S. Induction of pluripotent stem cells from mouse embryonic and adult fibroblast cultures by defined factors. Cell. 2006;126:663–76. - PubMed
    1. Wernig M, et al. In vitro reprogramming of fibroblasts into a pluripotent ES-cell-like state. Nature. 2007;448:318–24. - PubMed
    1. Liao J, et al. Generation of Induced Pluripotent Stem Cell Lines from Adult Rat Cells. Cell Stem Cell. 2008 - PubMed

Publication types

MeSH terms

Associated data