. 2009 Sep;10(9):965-72.
doi: 10.1038/ni.1771. Epub 2009 Aug 9.

TANK is a negative regulator of Toll-like receptor signaling and is critical for the prevention of autoimmune nephritis

Affiliations

TANK is a negative regulator of Toll-like receptor signaling and is critical for the prevention of autoimmune nephritis

Tatsukata Kawagoe et al. Nat Immunol. 2009 Sep.

Abstract

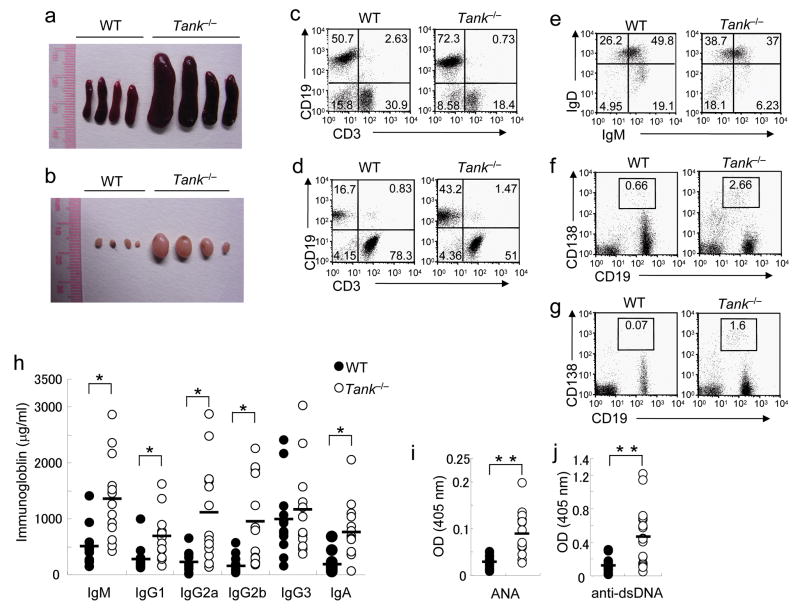
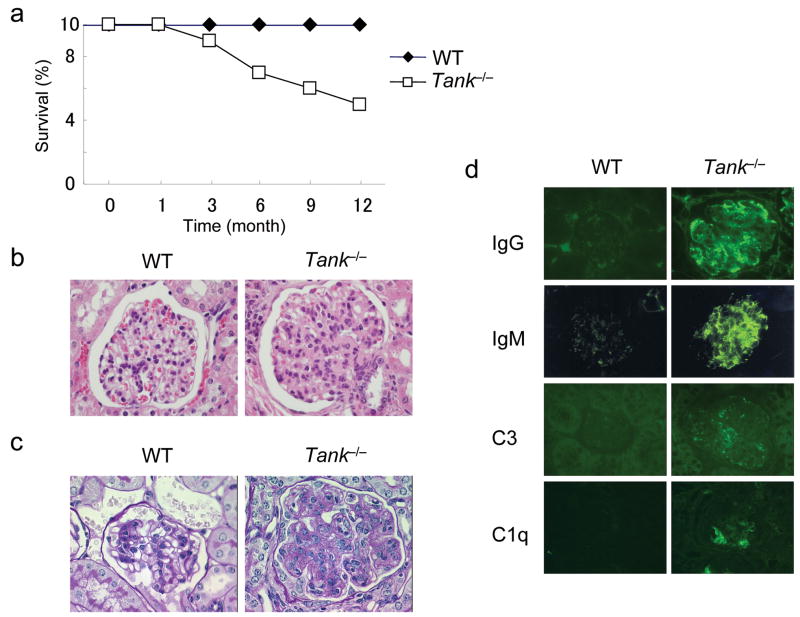
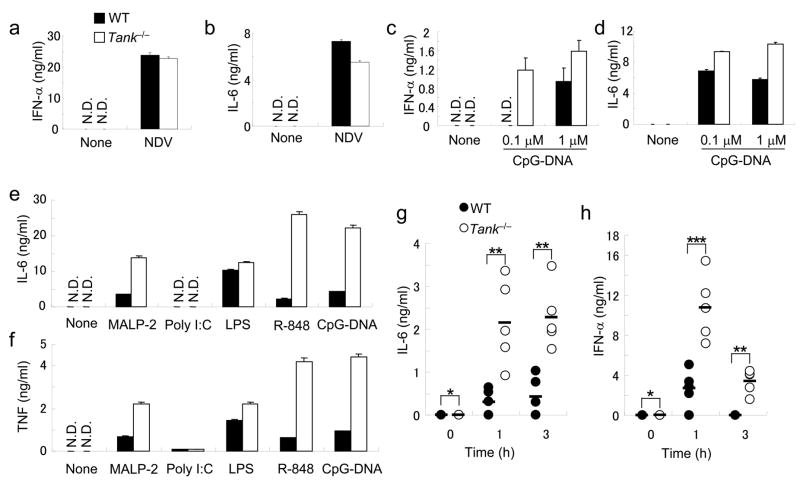
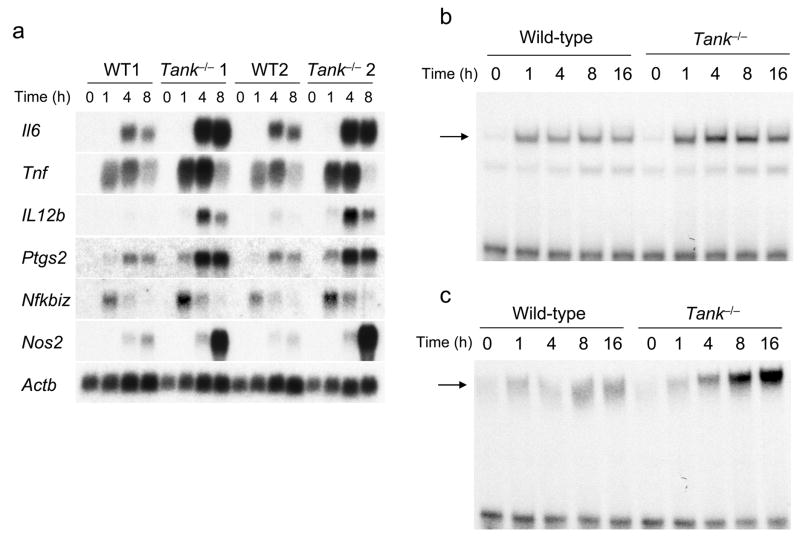
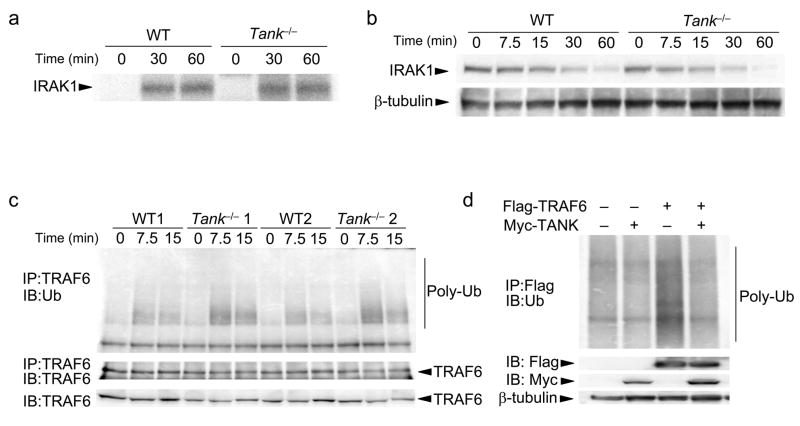
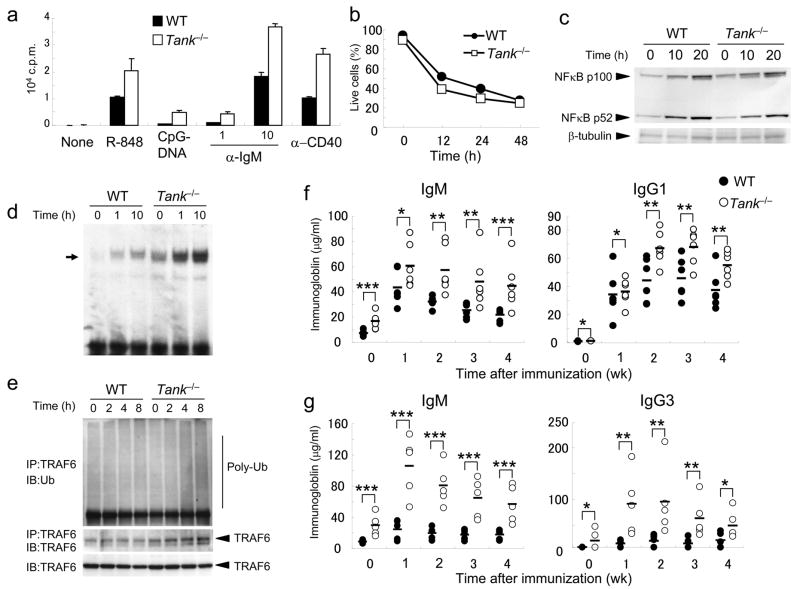
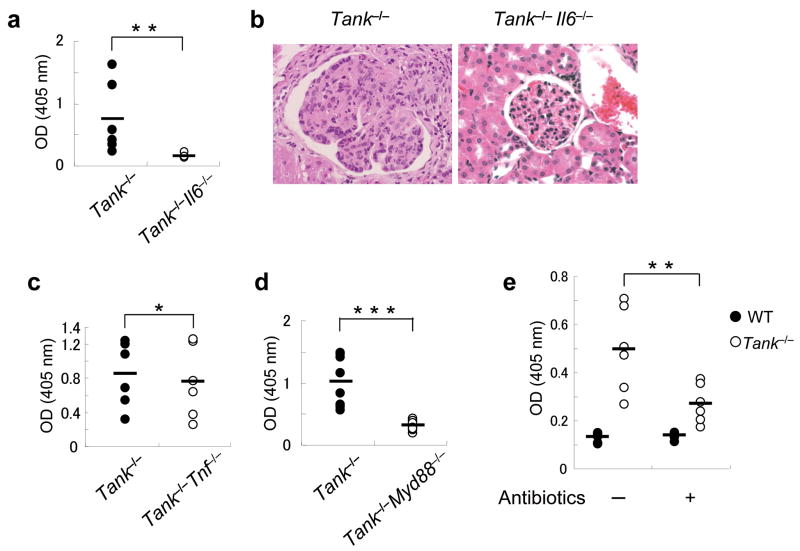
The intensity and duration of immune responses are controlled by many proteins that modulate Toll-like receptor (TLR) signaling. TANK has been linked to positive regulation of the transcription factors IRF3 and NF-kappaB. Here we demonstrate that TANK is not involved in interferon responses and is a negative regulator of proinflammatory cytokine production induced by TLR signaling. TLR-induced polyubiquitination of the ubiquitin ligase TRAF6 was upregulated in Tank(-/-) macrophages. Notably, Tank(-/-) mice spontaneously developed fatal glomerulonephritis owing to deposition of immune complexes. Autoantibody production in Tank(-/-) mice was abrogated by antibiotic treatment or the absence of interleukin 6 (IL-6) or the adaptor MyD88. Our results demonstrate that constitutive TLR signaling by intestinal commensal microflora is suppressed by TANK.


Conflict of interest statement

Disclosure

The authors declare that they have no competing financial interests.

Figures

Figure 1
Figure 1. Increased Ig and autoantibody production due to B cell abnormalities in Tank−/− mice
(a,b) Images of representative spleens (a) and inguinal LNs (b) from 6-month-old wild-type (WT) and Tank−/− mice. (cg) Expanded plasma cell populations in spleens and LNs of Tank−/− mice. The percentages of B cells and T cells in spleens (c) and LNs (d), expression of IgM and IgD on splenic B cells (e) and expression of CD138 and CD19 on cells in spleens (f) and LNs (g), from WT and Tank−/− mice were analyzed by FACS. (h) Basal titers of Ig isotypes in sera from nonimmunized 3-month-old WT (n = 13) and Tank−/− (n = 13) mice were measured by ELISA. (i, j) ANA (i) and anti-dsDNA Abs (j) in sera from 12-month-old WT (n = 12) and Tank−/− (n = 12) mice were measured by ELISA. *, P<0.005, **, P<0.001, versus Tank−/− cells.
Figure 2
Figure 2. Development of lethal glomerulonephritis in Tank−/− mice
(a) The survival of WT (n = 10) and Tank−/− (n = 10) mice was monitored for 1 year. (b,c) Kidney sections from 6-month-old WT and Tank−/− mice were stained with hematoxylin and eosin (H&E) (b) or Periodic acid-Schiff (PAS) (c). (d) Kidney sections from 6-month-old WT and Tank−/− mice were stained with FITC-labeled anti-mouse IgG, IgM, C3 and C1q.
Figure 3
Figure 3. Enhanced proinflammatory cytokine production in response to TLR stimulation in Tank−/− mice
(a,b) BM-DCs from wild-type and Tank−/− mice were infected with NDV for 24 h. The concentrations of IFN-α (a) and IL-6 (b) in the culture supernatants were measured by ELISA. (c,d) Flt3L-DCs from wild-type and Tank−/− mice were stimulated with 0.1 or 1μM CpG-DNA for 24 h. The concentrations of IFN-α (c) and IL-6 (d) in the culture supernatants were measured by ELISA. (e,f) Peritoneal macrophages from wild-type and Tank−/− mice were stimulated with MALP-2 (10 ng/ml), poly I:C (100 μg/ml), LPS (100 ng/ml), R-848 (10 nM) or CpG-DNA (1 μM) for 24 h. The concentrations of IL-6 (e) and TNF (f) in the culture supernatants were measured by ELISA. (g, h) Wild-type (n = 5) and Tank−/− (n = 5) mice were intraperitoneally injected with 30 nmol of R-848. Sera were collected and the concentrations of IL-6 (g) and IFN-α (h) were determined by ELISA. Data represent the means ± s.d. of triplicate assays. Similar results were obtained in three independent experiments. *, P < 0.05, **, P < 0.01 and ***, P < 0.005, versus Tank−/− mice.
Figure 4
Figure 4. TANK negatively regulates the activation of NF-κB and AP-1 as well as gene expression in response to TLR7 stimulation in macrophages
(a) Peritoneal macrophages from wild-type (WT) and Tank−/− mice were stimulated with 10 nM R-848 for the indicated periods. Total RNA was extracted and subjected to Northern blot analyses for the expression of Il6, Tnf, Il12b, Ptgs2, Nfkbiz and Nos2. The same membranes were rehybridized with an Actb probe. Data of two independent experiments (lanes marked 1 and 2 represent distinct experiments) are shown. (b,c) Wild-type and Tank−/− macrophages were stimulated with R-848 (10 μM) for the indicated periods. Nuclear extracts were prepared, and the NF-κB (b) and AP-1 (c) DNA-binding activities were determined by EMSA using NF-κB- and AP-1-specific probes. The arrows indicate the induced NF-κB and AP-1 complexes. The results are representative of three independent experiments.
Figure 5
Figure 5. TANK controls TRAF6 ubiquitination in response to TLR7 stimulation in macrophages
(a) Peritoneal macrophages from wild-type (WT) and Tank−/− mice were stimulated with 10μM R-848 for the indicated periods. Cell lysates were prepared and immunoprecipitated with anti-IRAK1. The kinase activities in the immunoprecipitates were measured using an in vitro kinase assay. (b) Macrophages from wild-type and Tank−/− mice were stimulated with 10 μM R-848 for the indicated periods. Whole cell lysates were subjected to immunoblot analysis with anti-IRAK1. Immunoblots ofβ-tubulin are shown as a loading control. (c) Cell lysates of macrophages treated with R-848 for the indicated periods were immunoprecipitated with anti-TRAF6, followed by immunoblot analysis with anti-Ub. Immunoblots of TRAF6 are shown as a loading control. Data of two independent experiments are shown. (d) HEK293 cells were cotransfected with Flag-TRAF6 and Myc-TANK. Cell lysates were immunoprecipitated with anti-Flag, followed by immunoblot analysis with anti-Ub. Immunoblots of β-tubulin are shown as a loading control. The data shown are representative of three independent experiments.
Figure 6
Figure 6. Enhanced activation of B cells in Tank−/− mice
(a) Purified splenic B cells were cultured with R-848 (10 nM), CpG-DNA (10 nM), anti-IgM (1, 10μg/ml) or anti-CD40 (1 μg/ml) for 48 h. The samples were pulsed with [3H]-thymidine (1 μCi) for the last 16 h. [3H]-thymidine incorporation was measured using a β-scintillation counter. (b) Splenic B cells were cultured in the absence of cytokines for the indicated periods. The viability of the cells was determined by annexin V staining followed by flow cytometric analysis. (c) B cells from wild-type and Tank−/− mice were stimulated with 5μg/ml anti-CD40 for the indicated periods, and the processing of p100 to p52 in whole cell lysates was detected by immunoblot analysis. Immunoblots of β-tubulin are shown as a loading control. (d) B cells from wild-type and Tank−/− mice were stimulated with 5μg/ml anti-CD40 for the indicated periods. Nuclear extracts were prepared and the NFκB DNA-binding activity was determined by EMSA. The arrow indicates the induced NF-κB complex. (e) Cell lysates of splenic B cells treated with 5μg/ml anti-CD40 for the indicated periods were immunoprecipitated with anti-TRAF6, followed by immunoblot analysis with anti-Ub. Immunoblots of TRAF6 are shown as a loading control. The data shown are representative of three independent experiments. (f) Mice were immunized with nitrophenol-chicken γ-globulin, and nitrophenol (NP)-specific IgM and IgG1 production was measured by ELISA at 1, 2, 3 and 4 weeks after immunization. The data for 5 representative mice per genotype are shown. (g) Mice were immunized with trinitrophenol-Ficoll, and trinitrophenol (TNP)-specific IgM and IgG3 production was measured at 1, 2, 3 and 4 weeks after immunization. The data for 5 representative mice per genotype are shown. *, P > 0.05, **, P < 0.05 and ***, P < 0.01, versus Tank−/− mice.
Figure 7
Figure 7. Antibiotic treatment as well as deficiency of MyD88 or IL-6 ameliorates autoantibody production in Tank−/− mice
(a) Anti-dsDNA Abs in sera from 5-month-old Tank−/− (n = 6) and Tank−/−IL-6−/− (n = 6) mice. (b) H&E staining of kidney sections from Tank−/− and Tank−/−IL-6−/− mice. (c,d) Anti-dsDNA Abs in Tank−/− (n = 6) and Tank−/−Tnf−/− (n = 6) mice (c), Tank−/− (n = 6) and Tank−/−MyD88−/− (n = 6) mice (d) were measured by ELISA. (e) Oral treatment with antibiotics reduces the serum anti-dsDNA Ab concentrations in Tank−/− mice. WT (n = 6) and Tank−/− (n = 6) mice were given drinking water containing ampicillin (1 g/L), neomycin (1 g/L), vancomycin (0.5 g/L) and metronidazole (1 g/L) after birth. Control wild-type (n = 6) and Tank−/− (n = 6) mice received untreated drinking water. The serum anti-dsDNA Ab concentrations were measured by ELISA at 16 weeks of age.

References

    1. Akira S, Uematsu S, Takeuchi O. Pathogen recognition and innate immunity. Cell. 2006;124:783–801. - PubMed
    1. Beutler B. Inferences, questions and possibilities in Toll-like receptor signalling. Nature. 2004;430:257–263. - PubMed
    1. Medzhitov R. Recognition of microorganisms and activation of the immune response. Nature. 2007;449:819–826. - PubMed
    1. Kawai T, Adachi O, Ogawa T, Takeda K, Akira S. Unresponsiveness of MyD88-deficient mice to endotoxin. Immunity. 1999;11:115–122. - PubMed
    1. Yamamoto M, et al. Role of adaptor TRIF in the MyD88-independent toll-like receptor signaling pathway. Science. 2003;301:640–643. - PubMed

Publication types

MeSH terms