. 2009 Aug 11;3(8):e502.
doi: 10.1371/journal.pntd.0000502.

Phenotypic screen of early-developing larvae of the blood fluke, schistosoma mansoni, using RNA interference

Affiliations

Phenotypic screen of early-developing larvae of the blood fluke, schistosoma mansoni, using RNA interference

M M Mourão et al. PLoS Negl Trop Dis. .

Erratum in

  • PLoS Negl Trop Dis. 2009;3(9):10. doi: 10.1371/annotation/ffd29b50-4102-46b9-b6a1-cdb4984df278.. de Moraes Mourão, Marina [corrected to Mourão, M M].

Abstract

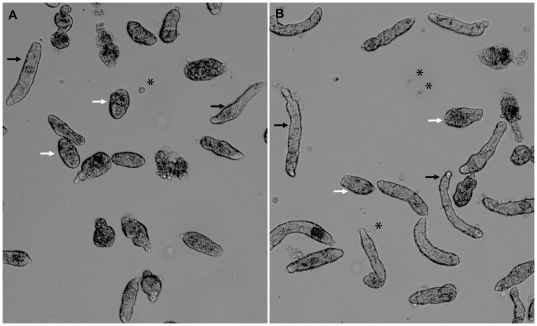
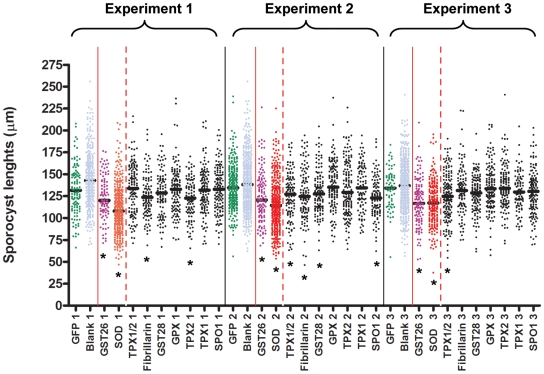
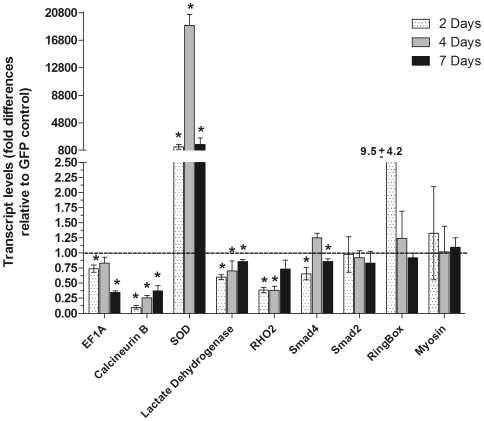
RNA interference (RNAi) represents the only method currently available for manipulating gene-specific expression in Schistosoma spp., although application of this technology as a functional genomic profiling tool has yet to be explored. In the present study 32 genes, including antioxidants, transcription factors, cell signaling molecules and metabolic enzymes, were selected to determine if gene knockdown by RNAi was associated with morphologically definable phenotypic changes in early intramolluscan larval development. Transcript selection was based on their high expression in in vitro cultured S. mansoni primary sporocysts and/or their potential involvement in developmental processes. Miracidia were allowed to transform to sporocysts in the presence of synthesized double-stranded RNAs (dsRNAs) and cultivated for 7 days, during which time developing larvae were closely observed for phenotypic changes including failure/delay in transformation, loss of motility, altered growth and death. Of the phenotypes evaluated, only one was consistently detected; namely a reduction in sporocyst size based on length measurements. The size-reducing phenotype was observed in 11 of the 33 (33%) dsRNA treatment groups, and of these 11 phenotype-associated genes (superoxide dismutase, Smad1, RHO2, Smad2, Cav2A, ring box, GST26, calcineurin B, Smad4, lactate dehydrogenase and EF1alpha), only 6 demonstrated a significant and consistent knockdown of specific transcript expression. Unexpectedly one phenotype-linked gene, superoxide dismutase (SOD), was highly induced ( approximately 1600-fold) upon dsRNA exposure. Variation in dsRNA-mediated silencing effects also was evident in the group of sporocysts that lacked any definable phenotype. Out of 22 nonphenotype-expressing dsRNA treatments (myosin, PKCB, HEXBP, calcium channel, Sma2, RHO1, PKC receptor, DHHC, PepcK, calreticulin, calpain, Smeg, 14.3.3, K5, SPO1, SmZF1, fibrillarin, GST28, GPx, TPx1, TPx2 and TPx2/TPx1), 12 were assessed for the transcript levels. Of those, 6 genes exhibited consistent reductions in steady-state transcript levels, while expression level for the rest remained unchanged. Results demonstrate that the efficacy of dsRNA-treatment in producing consistent phenotypic changes and/or altered gene expression levels in S. mansoni sporocysts is highly dependent on the selected gene (or the specific dsRNA sequence used) and the timing of evaluation after treatment. Although RNAi holds great promise as a functional genomics tool for larval schistosomes, our finding of potential off-target or nonspecific effects of some dsRNA treatments and variable efficiencies in specific gene knockdown indicate a critical need for gene-specific testing and optimization as an essential part of experimental design, execution and data interpretation.


Conflict of interest statement

The authors have declared that no competing interests exist.

Figures

Figure 1
Figure 1. In vitro cultured S. mansoni larvae 7 days post-dsRNA treatments.
Brightfield photomicrographs of in vitro cultured Schistosoma mansoni sporocysts after 7 days of treatments with a specific GST26-dsRNA (A) compared to the control GFP-dsRNA (B), illustrating the effects of exposure to phenotype-inducing GST26-dsRNA on sporocyst lengths. Arrows indicate examples of shortened (white arrows) and normal elongate (black arrows) sporocysts measured in both treatments. Asterisks indicate rounded ciliated epidermal plates that were shed from the miracidial surface after transformation.
Figure 2
Figure 2. S. mansoni sporocyst length measurements post-dsRNA treatments.
Graphic representation of sporocyst length measurements (µm) after 7 days of dsRNA treatments, from 3 independent experiments (A–C). Sporocyst length measurements are represented by scatter plots with the calculated median values indicated by the horizontal bars within each dsRNA treatment. The median values for specific dsRNA treatments were compared to both GFP-dsRNA (green plots) and blank (no dsRNA; blue plots) treatment controls. For each of the 3 experiments, the pair of controls is shown in between solid and dashed vertical black lines, immediately followed by the gene-specific dsRNAs groups. The dsRNA treatments exhibiting significant differences from GFP and blank controls in all 3 replicate experiments are represented as colored plots, marked with an asterisk (Smad4, lactate dehydrogenase, Smad2, Cav2A, EF1α, Smad1, RHO2, calcineurin B, and ring box), while those yielding inconsistent phenotypic differences when compared to the controls (myosin, PKCB, HEXBP, SmZF1, calcium channel, Sma2, RHO1, PKC receptor, DHHC, Pepck, calreticulin, calpain, Smeg, 14.3.3, and K5) are indicated by black dot scatter plots. Of this latter group, asterisks denote those individual replicates that were significantly different from controls. All treatments were statistical analyzed using Mann-Whitney U-test within each experiment, *P≤0.05.
Figure 3
Figure 3. Additional S. mansoni sporocyst length measurements 7 days post-dsRNA treatments.
Graphic representation of sporocyst lengths (µm) after 7 days post-dsRNA treatments, generated from 3 independent experiments covering an additional group of sporocyst-expressed genes. Larva lengths are represented by a dot scatter plots with the median length for each sporocyst treatment group shown as a short horizontal bar. Calculated medians for each target dsRNA group were compared to both GFP-dsRNA (green dots) and no-dsRNA (blank, blue dots) control median values. For each experiment, controls are the first 2 scatter plots shown between the solid red and black vertical lines, followed by the 2 dsRNA treatments that showed significant phenotypic differences in all 3 experiments (marked with *; GST26 and SOD) when compared to both controls. Black scatter plots represent dsRNA-treated sporocysts whose median length measurements exhibited inconsistent differences when compared to both GFP and blank controls. Of this latter group (TPx1/2, fibrillarin, GST28, GPx, TPx2, TPx1, and SPO1), asterisks denote those individual replicates that were significantly different from controls. Each experiment was analyzed using Mann-Whitney U-test, *P≤0.05.
Figure 4
Figure 4. Localization of rhodamine-labeled-dsRNA in S. mansoni larvae 7 days post-exposure.
Brightfield (A) and fluorescent (B) photomicrographs showing S. mansoni sporocysts and localization of rhodamine-dsRNA taken up after 7 days of labeled dsRNA exposure, respectively (100×). Arrowheads indicate rounded epidermal plates that were shed from miracidia during transformation to sporocysts. (B) Fluorescent images show the different levels of dsRNA penetrance within the same treatment and the same population. (C) The higher magnification (400×) illustrating the heterogeneity of dsRNA uptake within individual sporocysts in a given population including excretory ducts/flame cells (FC), cells within the parenchyma (PC), and tegument (T).
Figure 5
Figure 5. Transcript levels of dsRNA-treated sporocysts 7 days after dsRNA exposure.
Bar graph depicting the relative steady-state transcript levels of dsRNAs-treated sporocysts after 7 days of exposure compared to the GFP-dsRNA control. For each dsRNA tested, data are represented as mean fold-differences (+/−S.E.) relative to the GFP control (1.00). Colored bars represent sporocyst mRNA levels showing consistent and statistically significant decrease (dsRNA-Smad4/GFP, P = 0.0056; -lactate dehydrogenase/GFP, P = 0.0358; -Cav2A/GFP, P = 0.0136; -EF1α/GFP, P = 0.0358; -calcineurin B/GFP, P = 0.0189; -GST26/GFP, P = 0.0136; -SmZF1/GFP, P = 0.0189; -fibrillarin/GFP, P = 0.0407; -GST28/GFP, P = 0.0284; -GPx/GFP, P = 0.0269 and -TPx1/GFP, P = 0.0358/-TPx2/GFP, P = 0.0358) or increase (dsRNA-SOD/GFP, P = 0.0294) in target transcript levels when compared to the GFP-dsRNA control treatment. Tan-colored bars represent transcript levels for dsRNA-treated sporocysts that showed no differences when compared to GFP-dsRNA treated controls (-Smad2/GFP, P = 0.0755; -Smad1/GFP, P = 0.8969; -RHO2/GFP, P = 0.0765; -ring box/GFP, P = 0.7642; -myosin/GFP, P = 0.3725; -PKCB/GFP, P = 0.6579; -PEPCK/GFP, P = 0.3017; -calpain/GFP, P = 0.1642; -14.3.3/GFP, P = 0.6579; -K5/GFP, P = 0.3725 and -SPO1/GFP, P = 0.8969). In addition, bars located on the left of the solid red vertical line represent treated-sporocysts previously shown to express the shortened phenotype (dsRNA-Smad4, -lactate dehydrogenase, -Smad2, -Cav2A, -EF1α, -Smad1, -RHO2, -calcineurin B, -ring box, -GST26 and -SOD). Transcript levels were determined by q-PCR and data analyzed using the ΔΔCt method followed by statistical analysis using the Mann-Whitney U-test. Significance levels were set at P≤0.05. Data were generated from 3–5 independent experiments.
Figure 6
Figure 6. Transcript levels in S. mansoni sporocysts at different times post-dsRNA treatment.
Time-course of steady-state transcript levels was assessed in sporocysts treated with dsRNAs under culture conditions. Sporocysts were treated with dsRNA-EF1α, -calcineurin B, -SOD, -lactate dehydrogenase, -RHO2, Smad2, -Smad4, -myosin and -ring box for 2 days (stippled bars) or 4 days (gray bars), and compared to 7 day dsRNA treatment effects (black bars). Transcript levels were assessed by q-PCR at each time and compared to its matched GFP-dsRNA control. For each dsRNA tested, data are represented as mean fold-difference (+/−S.E.) relative to the GFP control (1.00). However, statistical analyses were based on raw q-PCR values using the ΔΔCt method followed by statistical analysis using the Mann-Whitney U-test, N = 4, *P≤0.05. Two-day comparisons (stippled bars): dsRNA-EF1a/GFP, P = 0.028; -calcineurin B/GFP, P = 0.021; -SOD/GFP, P = 0.015; -lactate dehydrogenase/GFP, P = 0.041; - RHO2/GFP, P = 0.021; –Smad4/GFP, P = 0.028; -ring box/GFP, P = 0.3; -Smad2/GFP, P = 1.0; and -myosin/GFP, P = 0.059. Four-day comparisons (gray bars): dsRNA-EF1a/GFP, P = 0.0319; -calcineurin B/GFP, P = 0.03; -SOD/GFP, P = 0.028; -lactate dehydrogenase/GFP, P = 0.029; - RHO2/GFP, P = 0.021; –Smad4/GFP, P = 0.0286; -ring box/GFP, P = 0.884; -Smad2/GFP, P = 0.98; and -myosin/GFP, P = 0.9. Data for 7 day dsRNA treatments (black bars) were taken from identically performed experiments (data shown previously in Fig. 5), and are reproduced in Fig. 6 for graphic comparisons only. Statistics for this group of genes are provided in the Fig. 5 legend.
Figure 7
Figure 7. Quantification of differential EF1α protein levels in S. mansoni sporocysts post-dsRNA exposure.
Western blots of SDS-PAGE separated total proteins extracted from sporocysts treated for 7 days with elongation factor1α (EF1α) or GFP (control) dsRNA. A rabbit anti-EF1α was used to detect a 50 kDa S. mansoni EF1α, while a rabbit anti-SmGST26 antibody served as both a protein specificity and loading control. Note the presence of EF1α protein in dsRNA-GFP treated-sporocysts, but reduced reactivity in EF1α-dsRNA-silenced parasites. Significant knockdown of EF1α protein in EF1α dsRNA-treated parasites was confirmed by optical densitometry comparing protein band intensities of test and control dsRNA treatment groups after anti-GST26 normalization of each band. The bar graph shows an 80% reduction (+/−S.E.) in dsRNA-induced EF1α protein level in EF1α dsRNA-treated sporocysts relative to GFP controls. Statistical analyses were performed using Students t-test. *P≤0.05; N = 3.
Figure 8
Figure 8. Observations of differential expression of EF1α protein levels in S. mansoni sporocysts after dsRNA treatments.
Immunfluorescence photomicrographs of GFP dsRNA (control; A) and EF1α dsRNA (B) treated sporocysts showing EF1α protein-knockdown post RNAi treatments. Larvae were cultured with dsRNAs for 7 days and fixed prior to treatment with anti-EF1α antibody and Alexa 488-conjugated secondary antibody. Strong immunoreactivity (green fluorescence) is distributed among various cells and tissues within interior of control sporocysts (A), compared to only weak reactivity in EF1α dsRNA-treated sporocysts (B). Confocal images; 400×. N = 2.

Similar articles

Cited by

References

    1. http://www.who.int/tdr/publications/tdr-research-publications/swg-report... Scientific working group on Schistosomiasis Meeting report. 14–16 November 2005,Geneva, Switzerland.
    1. Steinmann P, Keiser J, Bos R, Tanner M, Utzinger J. Schistosomiasis and water resources development: systematic review, meta-analysis, and estimates of people at risk. Lancet Infect Dis. 2006;6:411–425. - PubMed
    1. van der Werf MJ, de Vlas SJ, Brooker S, Looman CW, Nagelkerke NJ, et al. Quantification of clinical morbidity associated with schistosome infection in sub-Saharan Africa. Acta Trop. 2003;86:125–139. - PubMed
    1. Hotez P, Ottesen E, Fenwick A, Molyneux D. The neglected tropical diseases: the ancient afflictions of stigma and poverty and the prospects for their control and elimination. Adv Exp Med Biol. 2006;582:23–33. - PubMed
    1. Engels D, Chitsulo L, Montresor A, Savioli L. The global epidemiological situation of schistosomiasis and new approaches to control and research. Acta Tropica. 2002;82 - PMC - PubMed