

Global brain gene expression analysis links glutamatergic and GABAergic alterations to suicide and major depression
- PMID: 19668376
- PMCID: PMC2719799
- DOI: 10.1371/journal.pone.0006585
Global brain gene expression analysis links glutamatergic and GABAergic alterations to suicide and major depression
Abstract
Background: Most studies investigating the neurobiology of depression and suicide have focused on the serotonergic system. While it seems clear that serotonergic alterations play a role in the pathogenesis of these major public health problems, dysfunction in additional neurotransmitter systems and other molecular alterations may also be implicated. Microarray expression studies are excellent screening tools to generate hypotheses about additional molecular processes that may be at play. In this study we investigated brain regions that are known to be implicated in the neurobiology of suicide and major depression are likely to represent valid global molecular alterations.
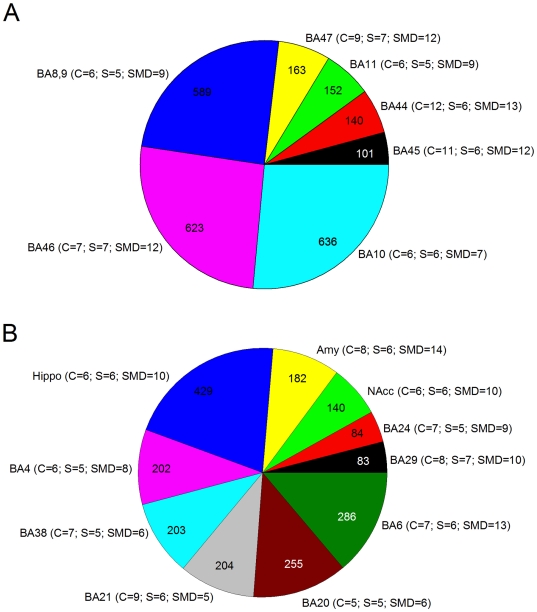
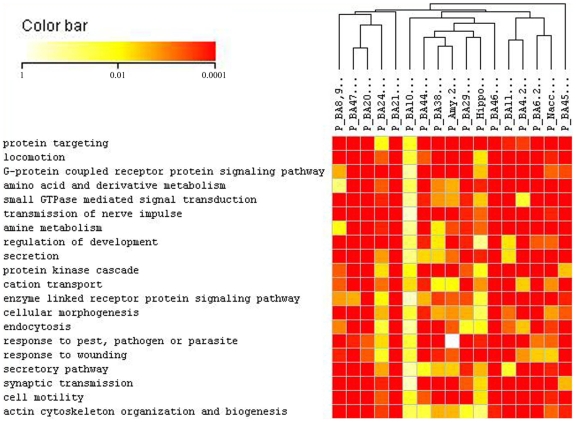
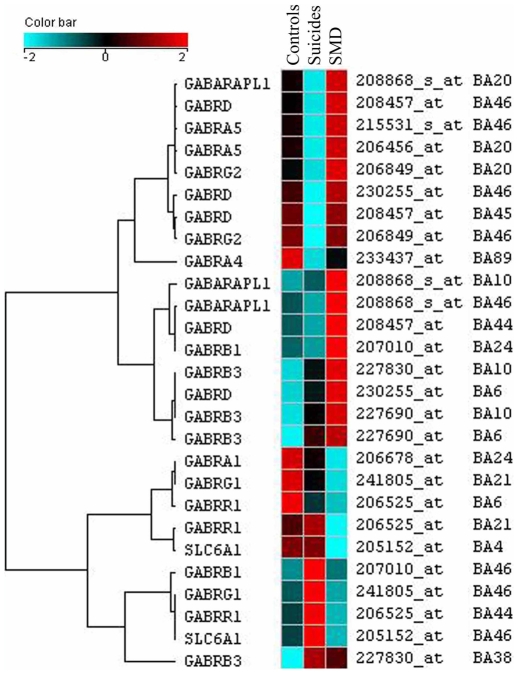
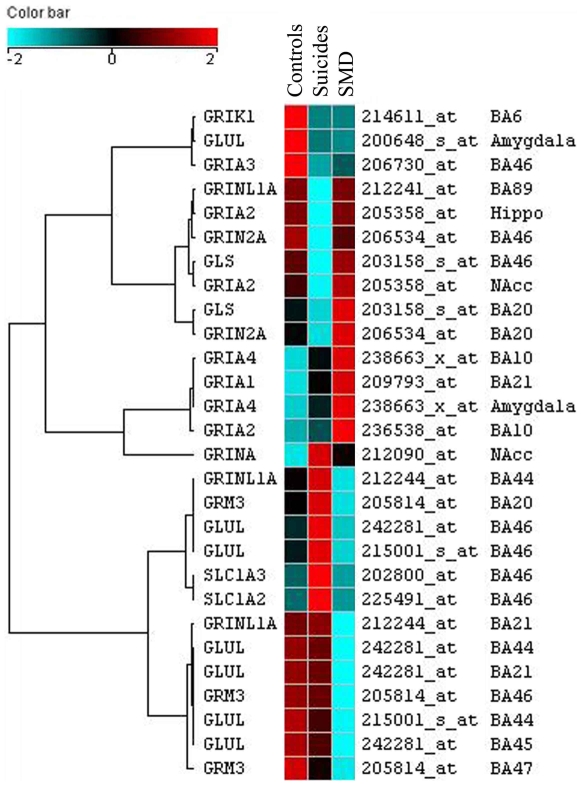
Methodology/principal findings: We performed gene expression analysis using the HG-U133AB chipset in 17 cortical and subcortical brain regions from suicides with and without major depression and controls. Total mRNA for microarray analysis was obtained from 663 brain samples isolated from 39 male subjects, including 26 suicide cases and 13 controls diagnosed by means of psychological autopsies. Independent brain samples from 34 subjects and animal studies were used to control for the potential confounding effects of comorbidity with alcohol. Using a Gene Ontology analysis as our starting point, we identified molecular pathways that may be involved in depression and suicide, and performed follow-up analyses on these possible targets. Methodology included gene expression measures from microarrays, Gene Score Resampling for global ontological profiling, and semi-quantitative RT-PCR. We observed the highest number of suicide specific alterations in prefrontal cortical areas and hippocampus. Our results revealed alterations of synaptic neurotransmission and intracellular signaling. Among these, Glutamatergic (GLU) and GABAergic related genes were globally altered. Semi-quantitative RT-PCR results investigating expression of GLU and GABA receptor subunit genes were consistent with microarray data.
Conclusions/significance: The observed results represent the first overview of global expression changes in brains of suicide victims with and without major depression and suggest a global brain alteration of GLU and GABA receptor subunit genes in these conditions.
Conflict of interest statement
Figures
References
-
- WHO. World Health Report 2000. Health Systems: Improving Performance 2000 - PubMed
-
- Blumenthal SJ, Kupfer DJ. Washington, DC: The Americal Psychiatric Press Inc; 1990. Suicide over the life cycle: risk factors, assessment, and treatment of suicidal patients.
-
- Turecki G. Suicidal Behavior: Is There a Genetic Predisposition? Bipolar Disorders. 2001;3:335–349. - PubMed
-
- Gross-Isseroff R, Biegon A, Voet H, Weizman A. The suicide brain: a review of postmortem receptor/transporter binding studies. Neurosci Biobehav Rev. 1998;22:653–661. - PubMed
-
- Mann JJ, Brent DA, Arango V. The neurobiology and genetics of suicide and attempted suicide: a focus on the serotonergic system. Neuropsychopharmacol. 2001;24:467–477. - PubMed
Publication types
MeSH terms
Substances
LinkOut - more resources
Full Text Sources
Other Literature Sources
Medical
