. 2008 Dec;2(4):801-16.
doi: 10.2147/opth.s3967.

Glial and endothelial blood-retinal barrier responses to amyloid-beta in the neural retina of the rat

Affiliations

Glial and endothelial blood-retinal barrier responses to amyloid-beta in the neural retina of the rat

Peter Jb Anderson et al. Clin Ophthalmol. 2008 Dec.

Abstract

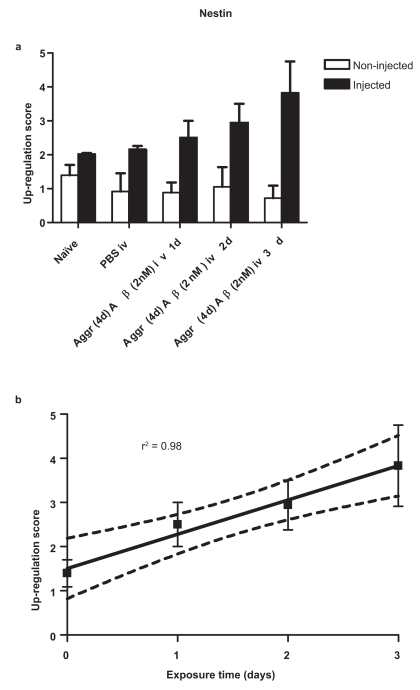
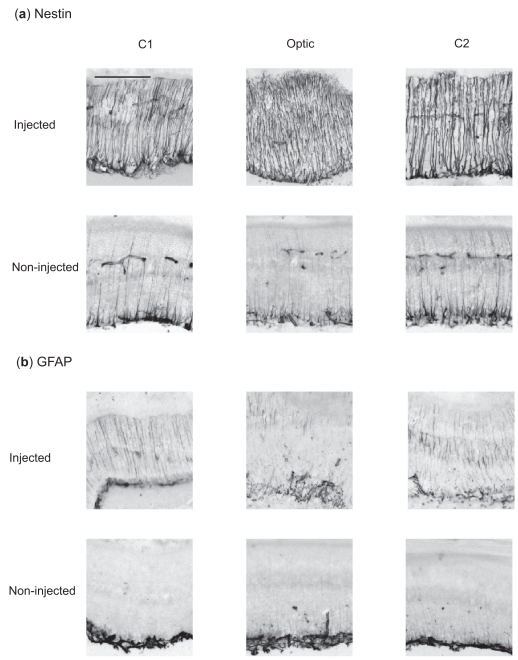
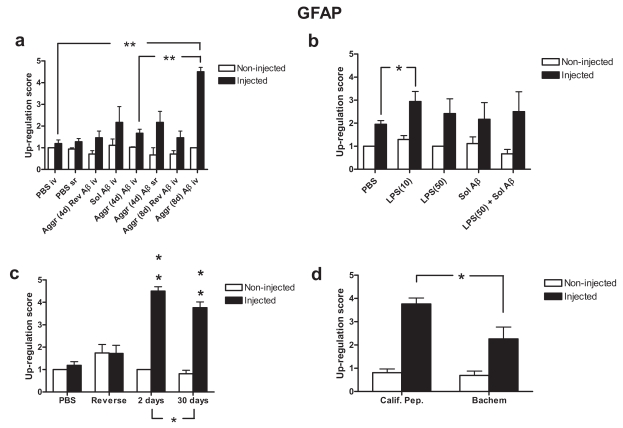
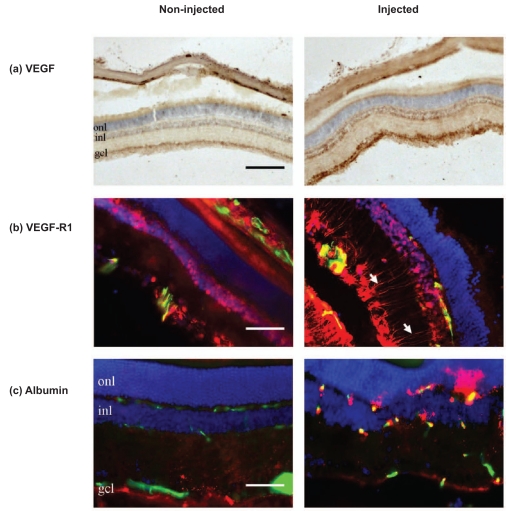
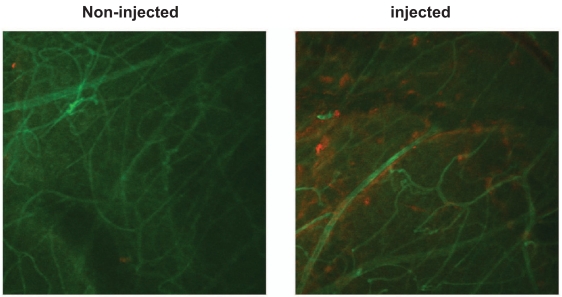
The effects of an intravitreal or subretinal injection of soluble or aggregated forms of Abeta(1-42) on retinal nestin-immunoreactivity (-IR) and glial fibrillary acidic protein (GFAP)-IR in astrocytes and Müller glial cells and the integrity of the blood-retinal barrier (BRB) were tested in the in vivo rat vitreal-retinal model. Retinas were exposed for 1, 2, 3, 5 or 30 days. We present novel data demonstrating that aggregated Abeta(1-42) up-regulates nestin-IR in astrocytes and Müller cells, with a graded response directly related to the length of pre-injection aggregation time. Similar results were obtained with GFAP-IR, but the signal was weaker. An intravitreal injection of aggregated Abeta(1-42) led to VEGF-IR up-regulation, particularly in the GCL and to a lesser extent in the INL. VEGFR1-IR (Flt1) was also increased, particularly in Müller cells and this was accompanied by marked leakage of albumin into the retinal parenchyma of the injected eye, but not in the contralateral eye.

Keywords: Müller cells; amyloid-β; blood-retinal barrier.


Figures

Figure 1
Figure 1
(a) Retinal nestin response 1, 2 and 3 days after a single intravitreal injection of 2 nmol/3 μL aggregated (4d) Aβ1–42. Each bar represents the mean ± SEM. (b) Linear trend of nestin response with time. Dotted lines represent 95% confidence limits.
Figure 2
Figure 2
Retinal nestin and GFAP response 48 hours after a single intravitreal injection of PBS (vehicle) or Aβ1–42 (5 nmol in 3 μL) pre-aggregated for 4 days. Note that both markers show marked up-regulation in retinas exposed to Aβ1–42 compared with those retinas exposed to PBS. Each panel corresponds to a 20 μm thick section. Abbreviations: GCL, ganglion cell layer; IPL, inner plexiform layer; INL, inner nuclear layer; OPL, outer plexiform layer; ONL, outer nuclear layer. Scale bar corresponds to 100 μm.
Figure 3
Figure 3
Immunohistochemical retinal response of (a) nestin and (b) GFAP 2 days after a single injection of Aβ1–42 (5 nmol in 3 μl PBS) pre-aggregated for 8 days. Note the smaller contralateral response in the non-injected eye. Each panel corresponds to a 20 μm section of retinal tissue. C1, Optic, and C2 correspond to 3 representative regions of the neural retina equidistant from one another. Scale bar, 100 μm.
Figure 4
Figure 4
Retinal nestin response to (a) a single injection of 5nmol/3 μl soluble Aβ1–42, aggregated (4d) Aβ1–42, aggregated (8d) delivered either intravitreally or subretinally; (b) a single intravitreal injection of 10 μg/mL LPS, 50 μg/mL LPS, soluble Aβ1–42 and a combination of 50 μg/mL LPS and soluble Aβ1–42; (c) 2 days and 30 days after a single injection of aggregated (8d) Aβ1–42; (d) a single intravitreal injection of aggregated (8d) Aβ1–42 derived from California Peptide and from Bachem for comparison. Score values are represented as Mean ± SEM. Levels of statistical significance are: *p < 0.05; **p < 0.01.
Figure 5
Figure 5
Retinal GFAP response to (a) a single injection of 5nmol/3 μl soluble Aβ1–42, aggregated (4d) Aβ1–42, aggregated (8d) delivered either intravitreally or subretinally; (b) a single intravitreal injection of 10 μg/mL LPS, 50 μg/mL LPS, soluble Aβ1–42 and a combination of 50 μg/mL LPS and soluble Aβ1–42; (c) 2 days and 30 days after a single injection of aggregated (8d) Aβ1–42; (d) a single intravitreal injection of aggregated (8d) Aβ1–42 derived from California Peptide and from Bachem for comparison. Score values are represented as Mean ± SEM. Levels of statistical significance are: *p < 0.05; **p < 0.01.
Figure 6
Figure 6
The response of (a) VEGF (DAB), (b) VEGF-R1 (red) and (c) albumin (red) 48 hours after a single intravitreal injection of aggregated Aβ1–42. Blood vessels are represented in green and cell nuclei in blue. (a) VEGF immunoreactivity is up-regulated by the Aβ1–42 injection, particularly in the GCL and within the inner and outer boundaries of the INL. (b) VEGF-R1 immunoreactivity increases in GCL, INL and in the Müller cell processes (white arrows), but not in the ONL. (c) Albumin leaks from the vasculature of the injected eye, but this is not the case in the contralateral non-injected eye. Note that albumin only appears in the vicinity of the retinal microvasculature. Scale bar, 100 μm in (a) and 50 μm in (b) and (c). Abbreviations: gcl, ganglion cell layer; inl, inner nuclear layer; onl, outer nuclear layer.
Figure 7
Figure 7
Aβ induces leakage of albumin from the retinal vasculature. Confocal images of retinal flatmounts of blood vessels labelled with antibody to RECA-1 (green) and albumin labelled with antibody raised against albumin (red). Note that the control (left) exhibits little or no albumin leakage, whereas the retina injected with Aβ1–42 (right) exhibits localized leakage around several blood vessels.

Similar articles

Cited by

References

    1. Abbott NJ, Rönnbäck L, Hansson E. Astrocyte-endothelial interactions at the blood-brain barrier. Nat Rev Neurosci. 2006;7:41–53. - PubMed
    1. Abramov A, Canevari L, Duchen MR. β-amyloid peptides induce mitochondrial dysfunction and oxidative stress in astrocytes and death of neurons through activation of NADPH oxidase. J Neurosci. 2004;24:565–75. - PMC - PubMed
    1. Alonso G, Privat A. Reactive astrocytes involved in the formation of lesional scars differ in the mediobasal hypothalamus and in other forebrain regions. J Neurosci Res. 1993;34:523–38. - PubMed
    1. Berzin TM, Zipser BD, et al. Agrin and microvascular damage in Alzheimer‘s disease. Neurobiol Aging. 2000;21:349–55. - PubMed
    1. Boscolo E, Folin M, Nico B, et al. Beta amyloid angiogenic activity in vitro and in vivo. Int J Mol Med. 2007;19:581–7. - PubMed