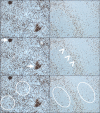
Ki-67 as a prognostic marker in mantle cell lymphoma-consensus guidelines of the pathology panel of the European MCL Network
- PMID: 19669190
- PMCID: PMC2725281
- DOI: 10.1007/s12308-009-0036-x
Ki-67 as a prognostic marker in mantle cell lymphoma-consensus guidelines of the pathology panel of the European MCL Network
Abstract
Mantle cell lymphoma (MCL) has a heterogeneous clinical course and is mainly an aggressive B cell non-Hodgkin lymphoma; however, there are some indolent cases The Ki-67 index, defined by the percentage of Ki-67-positive lymphoma cells on histopathological slides, has been shown to be a very powerful prognostic biomarker. The pathology panel of the European MCL Network evaluated methods to assess the Ki-67 index including stringent counting, digital image analysis, and estimation by eyeballing. Counting of 2 × 500 lymphoma cells is the gold standard to assess the Ki-67 index since this value has been shown to predict survival in prospective randomized trials of the European MCL Network. Estimation by eyeballing and digital image analysis showed a poor concordance with the gold standard (concordance correlation coefficients [CCC] between 0.29 and 0.61 for eyeballing and CCC of 0.24 and 0.37 for two methods of digital image analysis, respectively). Counting a reduced number of lymphoma cells (2 × 100 cells) showed high interobserver agreement (CCC = 0.74). Pitfalls of the Ki-67 index are discussed and guidelines and recommendations for assessing the Ki-67 index in MCL are given.
Figures


References
-
- Swerdlow SH, Campo E, Harris NL, Jaffe ES, Pileri SA, Stein H, Thiele J, Vardiman JW. WHO classification of tumors of the haematopoietic and lymphoid tissues. Lyon: IARC; 2008.
-
- Bottcher S, Ritgen M, Buske S, Gesk S, Klapper W, Hoster E, Hiddemann W, Unterhalt M, Dreyling M, Siebert R, Kneba M, Pott C. Minimal residual disease detection in mantle cell lymphoma: methods and significance of four-color flow cytometry compared to consensus IGH-polymerase chain reaction at initial staging and for follow-up examinations. Haematologica. 2008;93:551–559. doi: 10.3324/haematol.11267. - DOI - PubMed
-
- Bottcher S, Ritgen M, Pott C, Bruggemann M, Raff T, Stilgenbauer S, Dohner H, Dreger P, Kneba M. Comparative analysis of minimal residual disease detection using four-color flow cytometry, consensus IgH-PCR, and quantitative IgH PCR in CLL after allogeneic and autologous stem cell transplantation. Leukemia. 2004;18:1637–1645. doi: 10.1038/sj.leu.2403478. - DOI - PubMed
-
- Jong D, Rosenwald A, Chhanabhai M, Gaulard P, Klapper W, Lee A, Sander B, Thorns C, Campo E, Molina T, Norton A, Hagenbeek A, Horning S, Lister A, Raemaekers J, Gascoyne RD, Salles G, Weller E. Immunohistochemical prognostic markers in diffuse large B-cell lymphoma: validation of tissue microarray as a prerequisite for broad clinical applications—a study from the Lunenburg Lymphoma Biomarker Consortium. J Clin Oncol. 2007;25:805–812. doi: 10.1200/JCO.2006.09.4490. - DOI - PubMed
LinkOut - more resources
Full Text Sources
Other Literature Sources

