. 2009 Sep;11(3):570-80.
doi: 10.1208/s12248-009-9134-z. Epub 2009 Aug 8.

Statistical considerations for assessment of bioanalytical incurred sample reproducibility

Affiliations

Statistical considerations for assessment of bioanalytical incurred sample reproducibility

David Hoffman. AAPS J. 2009 Sep.

Abstract

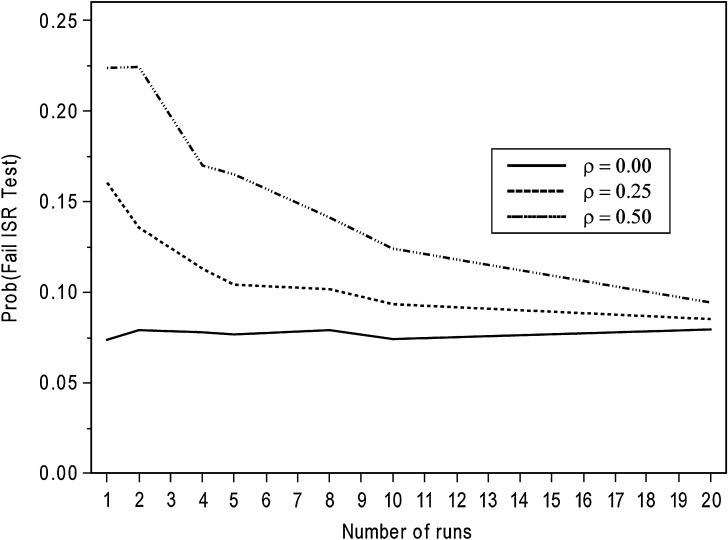
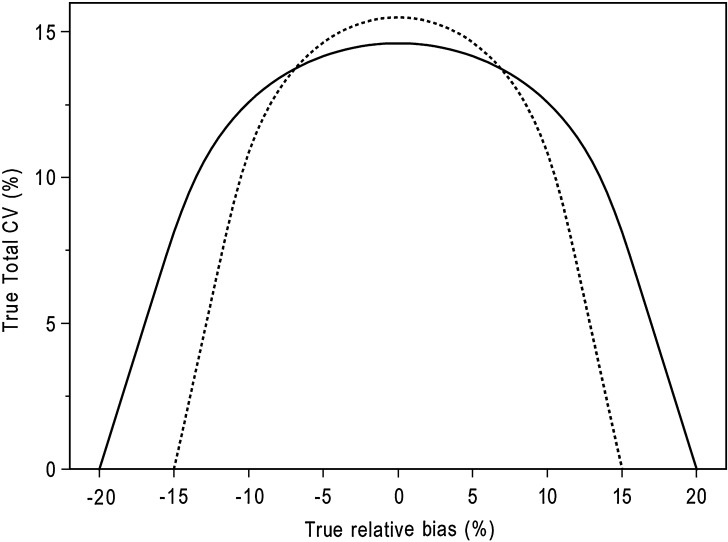
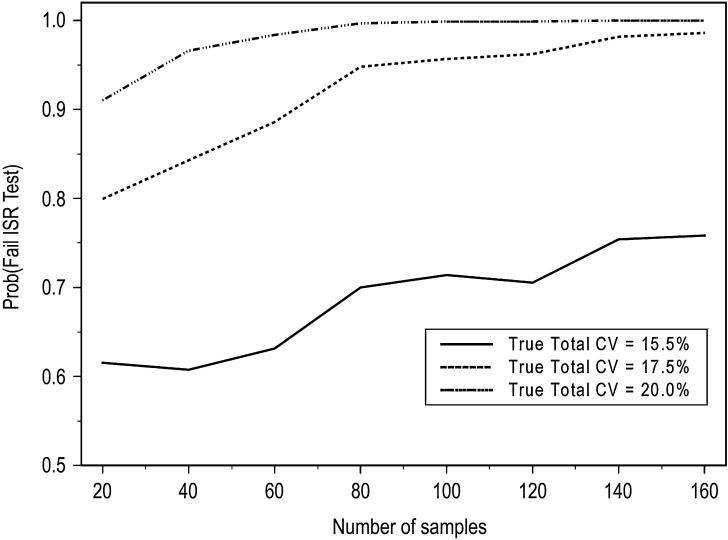
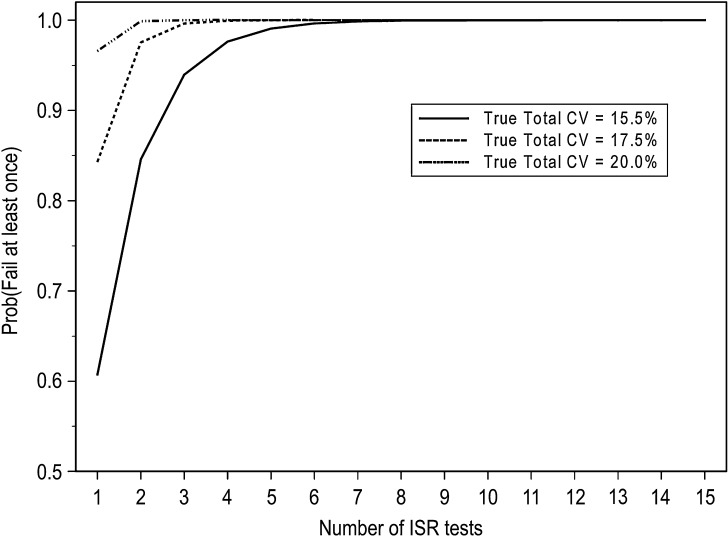
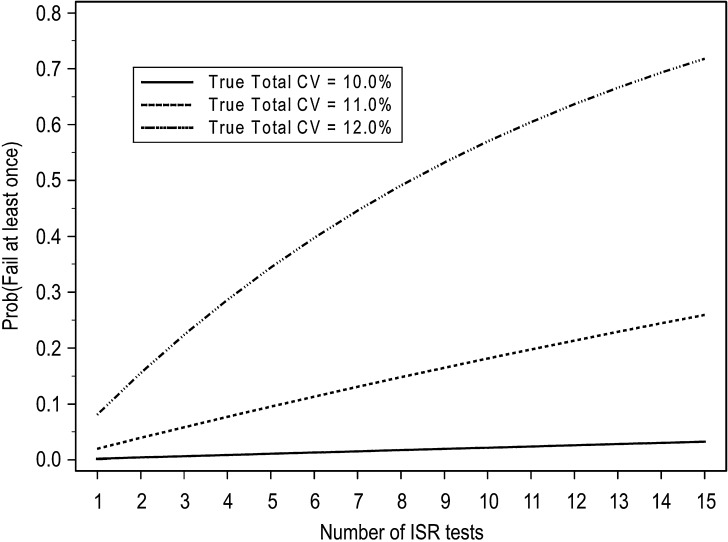
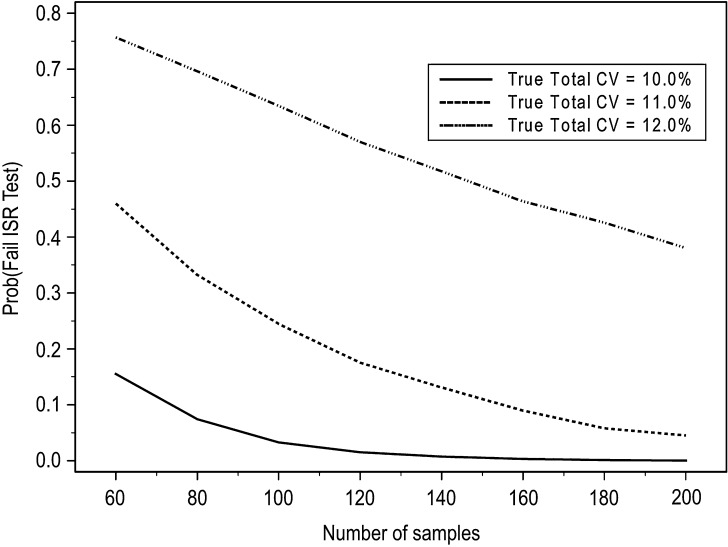
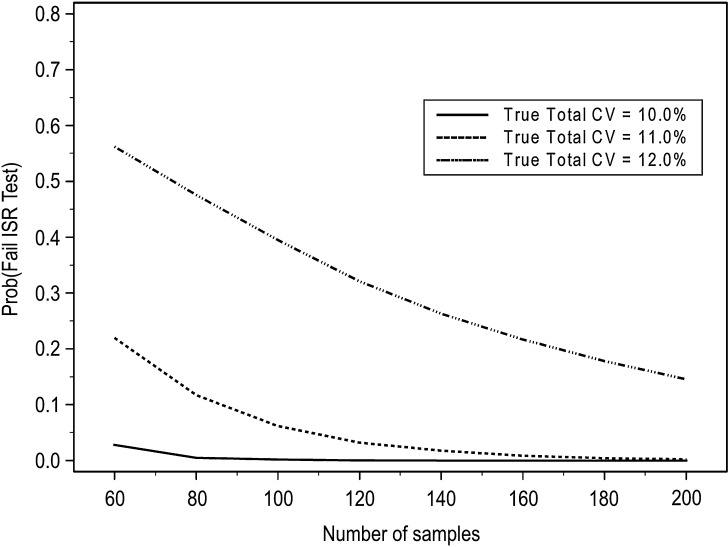
Bioanalytical method validation is generally conducted using standards and quality control (QC) samples which are prepared to be as similar as possible to the study samples (incurred samples) which are to be analyzed. However, there are a variety of circumstances in which the performance of a bioanalytical method when using standards and QCs may not adequately approximate that when using incurred samples. The objective of incurred sample reproducibility (ISR) testing is to demonstrate that a bioanalytical method will produce consistent results from study samples when re-analyzed on a separate occasion. The Third American Association of Pharmaceutical Scientists (AAPS)/Food and Drug Administration (FDA) Bioanalytical Workshop and subsequent workshops have led to widespread industry adoption of the so-called "4-6-20" rule for assessing incurred sample reproducibility (i.e. at least 66.7% of the re-analyzed incurred samples must agree within +/-20% of the original result), though the performance of this rule in the context of ISR testing has not yet been evaluated. This paper evaluates the performance of the 4-6-20 rule, provides general recommendations and guidance on appropriate experimental designs and sample sizes for ISR testing, discusses the impact of repeated ISR testing across multiple clinical studies, and proposes alternative acceptance criteria for ISR testing based on formal statistical methodology.


Figures

Fig. 1
Fig. 1
Probability of failing ISR test versus number of analytical runs, for various formula image. Sample size is 40 incurred samples. True total CV is 12% and true relative bias is 0%. Acceptance criteria based on the 4–6–20 rule
Fig. 2
Fig. 2
Acceptance regions defined by 4–6–15 rule for QC samples and 4–6–20 rule for incurred samples. Dashed curve gives combinations of true relative bias and total CV such that the true proportion of QC sample concentrations within ±15% of nominal value is 66.7%. Solid curve gives combinations of true relative bias and total CV such that the true proportion of incurred sample repeat concentrations within ±20% of original concentration is 66.7%
Fig. 3
Fig. 3
Probability of failing ISR test versus number of incurred samples, for true total CV = 15.5%, 17.5%, and 20.0%. True relative bias is 0%. Acceptance criteria based on the 4–6–20 rule
Fig. 4
Fig. 4
Probability of failing ISR test versus number of incurred samples, for true total CV = 10.0%, 11.0%, and 12.0%. True relative bias is 0%. Acceptance criteria based on the 4–6–20 rule
Fig. 5
Fig. 5
Probability of failing at least one ISR test versus number of ISR tests performed, for true total CV = 15.5%, 17.5%, and 20.0%. True relative bias is 0%. Sample size is 40 incurred samples per ISR test. Acceptance criteria based on the 4–6–20 rule
Fig. 6
Fig. 6
Probability of failing at least one ISR test versus number of ISR tests performed, for true total CV = 10.0%, 11.0%, and 12.0%. True relative bias is 0%. Sample size is 40 incurred samples per ISR test. Acceptance criteria based on 4–6–20 rule
Fig. 7
Fig. 7
Probability of failing ISR test versus number of incurred samples, for true total CV = 10.0%, 11.0%, and 12.0%. True relative bias is 0%. Acceptance criteria based on tolerance-interval approach
Fig. 8
Fig. 8
Probability of failing ISR test versus number of incurred samples, for true total CV = 10.0%, 11.0%, and 12.0%. True relative bias is 0%. Acceptance criteria based on containment-proportion approach

References

    1. Shah VP, Midha KK, Dighe SV, McGilveray IJ, Skelly JP, Yacobi A, et al. Analytical methods validation: bioavailability, bioequivalence, and pharmacokinetic studies. Pharm Res. 1992;9:588–592. doi: 10.1023/A:1015829422034. - DOI - PubMed
    1. Viswanathan CT, Bansal S, Booth B, DeStefano AJ, Rose MJ, Sailstad J, et al. Workshop/conference report - quantitative bioanalytical methods validation and implementation: best practices for chromatographic and ligand binding assays. AAPS J. 2007;9(1):E30–E42. doi: 10.1208/aapsj0901004. - DOI - PubMed
    1. Food and Drug Administration . Draft guidance for industry: bioanalytical method validation. Rockville, MD: US Food and Drug Administration; 1999.
    1. Fast D, Kelley M, Viswanathan CT, O’Shaughnessy J, King S, Chaudhary A, et al. Workshop report and follow-up—AAPS workshop on current topics in GLP bioanalysis: assay reproducibility for incurred samples—implications of Crystal City recommendations. AAPS J. 2009 - PMC - PubMed
    1. Kringle R. An assessment of the 4–6–20 rule for acceptance of analytical runs in bioavailability, bioequivalence, and pharmacokinetic studies. Pharm Res. 1994;11:556–560. doi: 10.1023/A:1018922701174. - DOI - PubMed

MeSH terms

LinkOut - more resources