

doi: 10.1007/s10867-008-9078-z.
Epub 2008 May 20.
Analysis of the temporal organization of sleep spindles in the human sleep EEG using a phenomenological modeling approach
Affiliations
- PMID: 19669472
- PMCID: PMC2585623
- DOI: 10.1007/s10867-008-9078-z
Item in Clipboard
Analysis of the temporal organization of sleep spindles in the human sleep EEG using a phenomenological modeling approach
J Biol Phys.
2008 Aug.
Abstract
The sleep electroencephalogram (EEG) is characterized by typical oscillatory patterns such as sleep spindles and slow waves. Recently, we proposed a method to detect and analyze these patterns using linear autoregressive models for short (approximately 1 s) data segments. We analyzed the temporal organization of sleep spindles and discuss to what extent the observed interevent intervals correspond to properties of stationary stochastic processes and whether additional slow processes, such as slow oscillations, have to be assumed. We have found evidence for such an additional slow process, most pronounced in sleep stage 2.
Figures
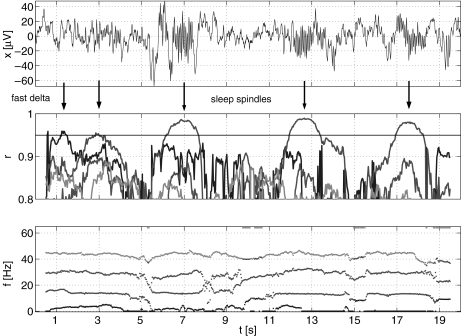
Detection of oscillatory events in a 20-s EEG segment of stage 2 non-REM sleep. Four sleep spindles and one fast delta oscillation were detected. The upper panel shows the EEG signal, the middle panel shows r, and the lower panel the corresponding frequencies f, with the colors indicating corresponding oscillatory modes. The detection threshold r
1 = 0.95 is indicated in the middle panel (see Section 2.2)
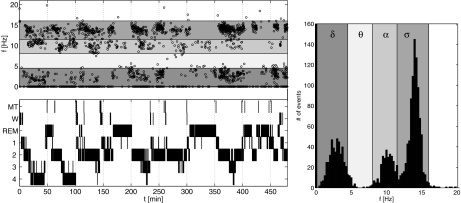
Detected oscillatory events in a single night (black dots represent single events), hypnogram (MT, movement time; W, waking, REM, rapid eye movement sleep; 1 to 4, nonrapid eye movement sleep stages 1 to 4), and corresponding histogram of the event frequencies. Colors indicate the different frequency bands
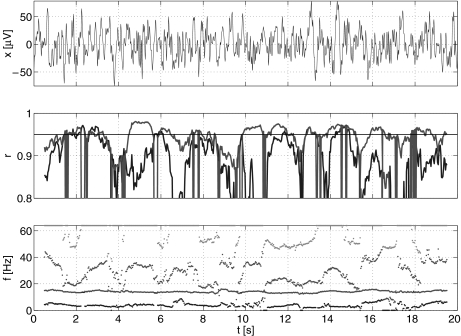
Twenty-second simulated AR(4) data with time-dependent modules and frequencies derived by fitting an AR(4) model similar to Fig. 1. The upper panel shows the signal, the middle panel shows r, and the lower panel the corresponding frequencies f, with the colors indicating corresponding oscillatory modes. The AR(4) model contained two oscillatory modes, one in the spindle frequency band, f = 14 Hz, r = 0.94, and one in the delta frequency band, f = 3Hz, r = 0.91
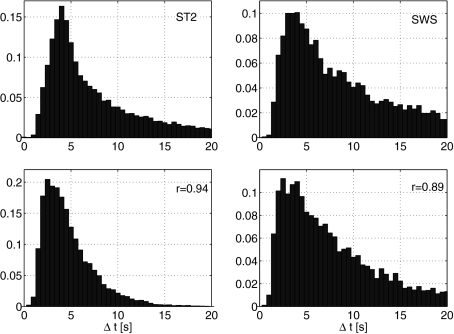
Normalized histograms (pooled data) of interevent intervals (Δt) in the spindle frequency range (11.5–16 Hz) in nonrapid eye movement sleep stage 2 (ST2; top left) and slow wave sleep (SWS, stages 3 and 4; top right) and of events in the spindle frequency range detected from data generated by stationary AR(4) models with r = 0.94 (bottom left) and r = 0.89 (bottom right) for the spindle frequency
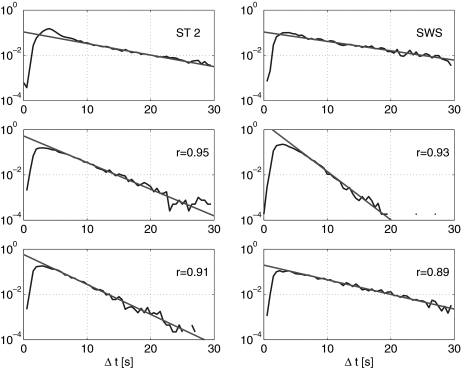
Normalized histograms of interevent intervals as in Fig. 4 but plotted on a semilogarithmic scale including additional values of r. The straight lines show fits to the exponential tails of these distributions
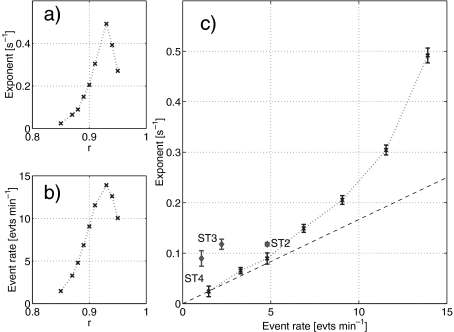
a Exponents from the fit of the exponential tails of the interevent interval distributions (Fig. 5) of the simulated AR(4) data as a function of r of the spindle frequency pole. b Event rate as a function of r. c Exponent of the exponential decay (mean ± SD) as a function of the event rate shown only for 0.85 ≤ r ≤ 0.93. Values for the empirical distributions (red) from sleep spindles shown separately for nonrapid eye movement sleep stages 2, 3, and 4. The straight line indicates the linear relationship as expected for a Poisson process
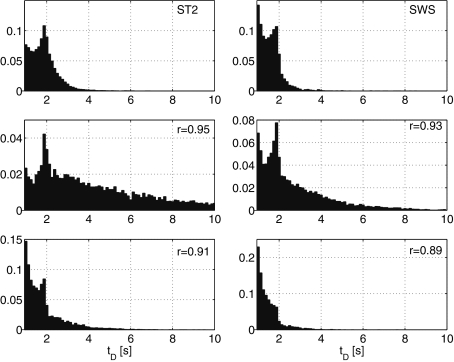
Normalized histograms (pooled data) of the event duration (t
D) in the spindle frequency range (11.5–16 Hz) in nonrapid eye movement sleep stage 2 (ST2; top left) and slow wave sleep (SWS, stages 3 and 4; top right) and events in the spindle frequency range from a stationary AR(4) process with different values of r for the spindle frequency
References
-
- Rechtschaffen A, Kales A. A manual of standardized terminology, techniques and scoring system for sleep stages of human subjects. Bethesda: National Institutes of Health; 1968. - PubMed
LinkOut - more resources
Full Text Sources
