

Use of game-theoretical methods in biochemistry and biophysics
- PMID: 19669489
- PMCID: PMC2577752
- DOI: 10.1007/s10867-008-9101-4
Use of game-theoretical methods in biochemistry and biophysics
Abstract
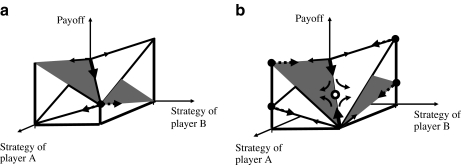
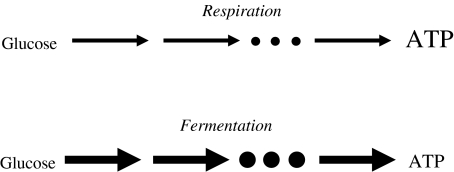
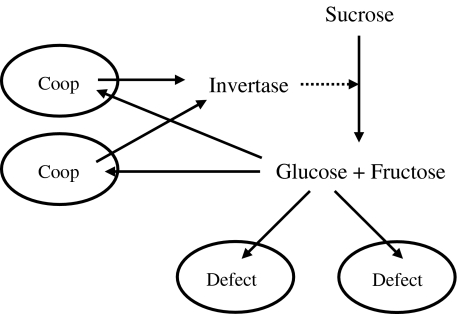
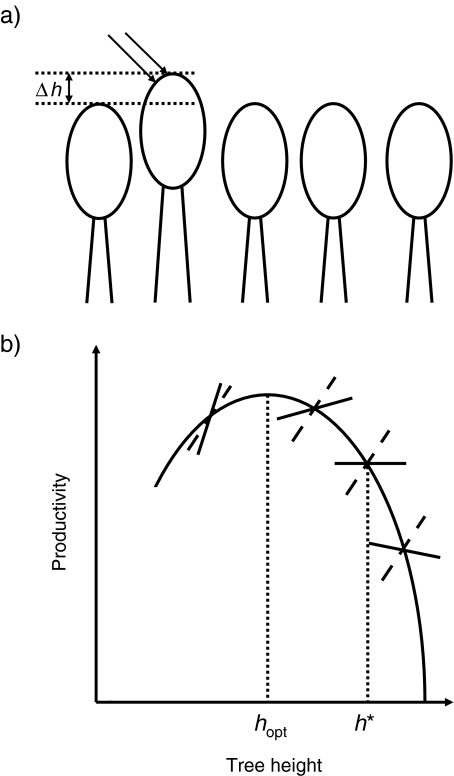
Evolutionary game theory can be considered as an extension of the theory of evolutionary optimisation in that two or more organisms (or more generally, units of replication) tend to optimise their properties in an interdependent way. Thus, the outcome of the strategy adopted by one species (e.g., as a result of mutation and selection) depends on the strategy adopted by the other species. In this review, the use of evolutionary game theory for analysing biochemical and biophysical systems is discussed. The presentation is illustrated by a number of instructive examples such as the competition between microorganisms using different metabolic pathways for adenosine triphosphate production, the secretion of extracellular enzymes, the growth of trees and photosynthesis. These examples show that, due to conflicts of interest, the global optimum (in the sense of being the best solution for the whole system) is not always obtained. For example, some yeast species use metabolic pathways that waste nutrients, and in a dense tree canopy, trees grow taller than would be optimal for biomass productivity. From the viewpoint of game theory, the examples considered can be described by the Prisoner's Dilemma, snowdrift game, Tragedy of the Commons and rock-scissors-paper game.
Figures
References
-
- {'text': '', 'ref_index': 1, 'ids': [{'type': 'DOI', 'value': '10.1007/BF02101984', 'is_inner': False, 'url': 'https://doi.org/10.1007/bf02101984'}, {'type': 'PubMed', 'value': '6429341', 'is_inner': True, 'url': 'https://pubmed.ncbi.nlm.nih.gov/6429341/'}]}
- Kacser, H., Beeby, R.: Evolution of catalytic proteins or on the origin of enzyme species by means of natural selection. J. Mol. Evol. 20(1), 38–51 (1984). doi:10.1007/BF02101984 - PubMed
-
- None
- Heinrich, R., Schuster, S.: The Regulation of Cellular Systems. Chapman & Hall, New York (1996)
-
- {'text': '', 'ref_index': 1, 'ids': [{'type': 'DOI', 'value': '10.1111/j.1432-1033.1997.t01-1-00527.x', 'is_inner': False, 'url': 'https://doi.org/10.1111/j.1432-1033.1997.t01-1-00527.x'}, {'type': 'PubMed', 'value': '9119021', 'is_inner': True, 'url': 'https://pubmed.ncbi.nlm.nih.gov/9119021/'}]}
- Meléndez-Hevia, E., Waddell, T.G., Heinrich, R., Montero, F.: Theoretical approaches to the evolutionary optimization of glycolysis – chemical analysis. Eur. J. Biochem. 244(2), 527–543 (1997). doi:10.1111/j.1432-1033.1997.t01-1-00527.x - PubMed
-
- {'text': '', 'ref_index': 1, 'ids': [{'type': 'DOI', 'value': '10.1002/bit.10047', 'is_inner': False, 'url': 'https://doi.org/10.1002/bit.10047'}, {'type': 'PubMed', 'value': '11745171', 'is_inner': True, 'url': 'https://pubmed.ncbi.nlm.nih.gov/11745171/'}]}
- Edwards, J.S., Ramakrishna, R., Palsson, B.O.: Characterizing the metabolic phenotype: a phenotype phase plane analysis. Biotechnol. Bioeng. 77(1), 27–36 (2002). doi:10.1002/bit.10047 - PubMed
-
- {'text': '', 'ref_index': 1, 'ids': [{'type': 'DOI', 'value': '10.1006/bulm.2000.0197', 'is_inner': False, 'url': 'https://doi.org/10.1006/bulm.2000.0197'}, {'type': 'PubMed', 'value': '11146883', 'is_inner': True, 'url': 'https://pubmed.ncbi.nlm.nih.gov/11146883/'}]}
- Ebenhöh, O., Heinrich, R.: Evolutionary optimization of metabolic pathways. Theoretical reconstruction of the stoichiometry of ATP and NADH producing systems. Bull. Math. Biol. 63(1), 21–55 (2001). doi:10.1006/bulm.2000.0197 - PubMed
LinkOut - more resources
Full Text Sources
Molecular Biology Databases
