

doi: 10.1007/s10867-009-9127-2.
Epub 2009 Feb 12.
Nonlinear analysis of the dynamics of DNA breathing
Affiliations
- PMID: 19669570
- PMCID: PMC2660396
- DOI: 10.1007/s10867-009-9127-2
Item in Clipboard
Nonlinear analysis of the dynamics of DNA breathing
J Biol Phys.
2009 Feb.
Abstract
The base pairs that encode the genetic information in DNA show large amplitude localized excitations called DNA breathing. We discuss the experimental observations of this phenomenon and its theoretical analysis. Starting from a model introduced to study the thermal denaturation of DNA, we show that it can qualitatively describe DNA breathing but is quantitatively not satisfactory. We show how the model can be modified to be quantitatively correct. This defines a nonlinear lattice model, which is interesting in itself because it has nonlinear localized excitations, forming a new class of discrete breather.
Figures
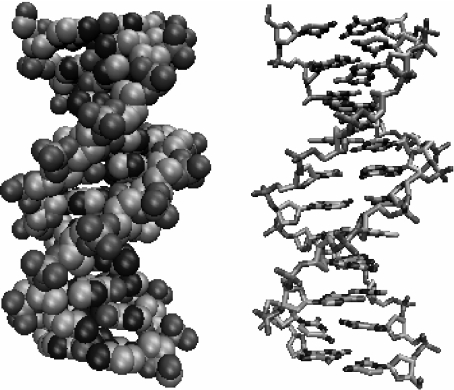
The structure of DNA in its B form in a full atomic representation (left) or in a schematic diagram showing the interatomic bonds
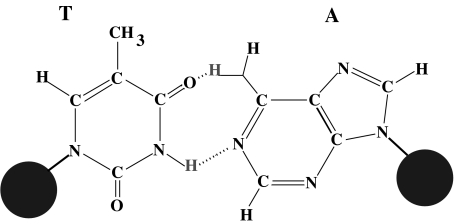
The AT base pair of DNA. The two large dots schematize the sugar-phosphate backbones. The dotted lines in the central part of the diagram indicate the hydrogen bonds that connect the two bases
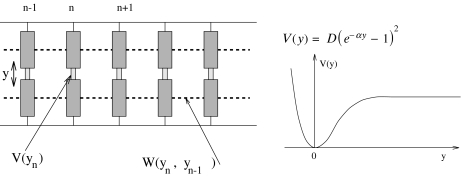
The simple dynamical model for DNA nonlinear dynamics, described by the Hamiltonian (1)
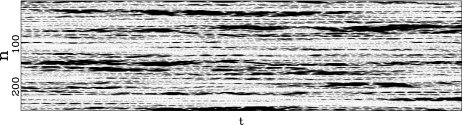
Numerical simulation of the DNA model in contact with a thermal bath at 270 K. The stretching of the base pairs is shown by a gray scale going from white for a closed pair to black for a fully open pair (y ≥ 2.0 Å). The vertical axis extends along the DNA chain, which has 256 base pairs in this calculation, with periodic boundary conditions. The horizontal axis corresponds to time. The time domain shown in this figure is 2 × 10 − 11 s. The parameters used for this calculation are m = 300 atomic mass units, D = 0.05254 eV, α = 4.0 Å − 1, K = 0.01 eV Å − 2, ρ = 3.0, δ = 0.8 Å − 1
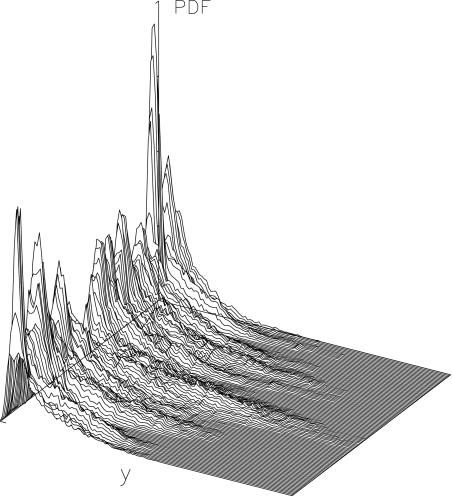
Local distribution  for the DNA model at temperature T = 300 K. Δn = 4, Δt = 2 × 10 − 10 s. The axis extending from left to right gives the values of the displacements y, and the axis going from front to back corresponds to n0. It extends along the 128 cells of the lattice used in the simulation, and the vertical axis corresponds to the distribution function
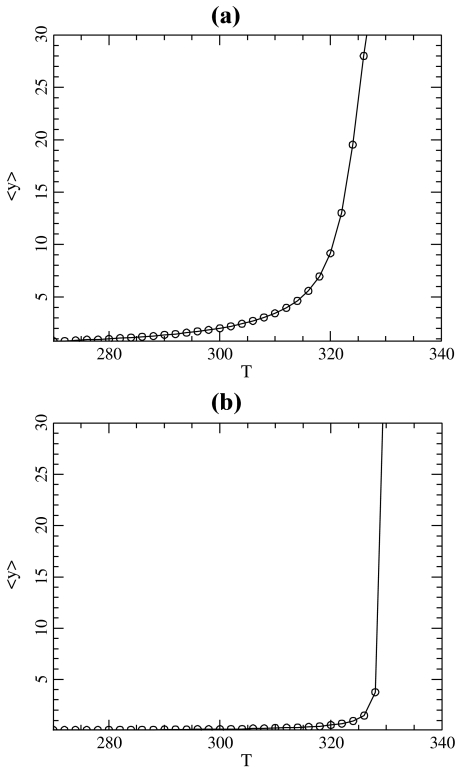
Average stretching of the base pairs in the DNA model described by the Hamiltonian (1) with the Morse potential (2) (a) and with the modified potential (4) (b). The parameters of the model are K = 0.01 eV Å − 2, ρ = 3.0, δ = 0.8 Å − 1, and D = 0.05254 eV, α = 4.0 Å − 1 for (a) ; D = 0.0857 eV α = β = 4.0 Å − 1, E = 4.0 eV Å − 1 for (b)
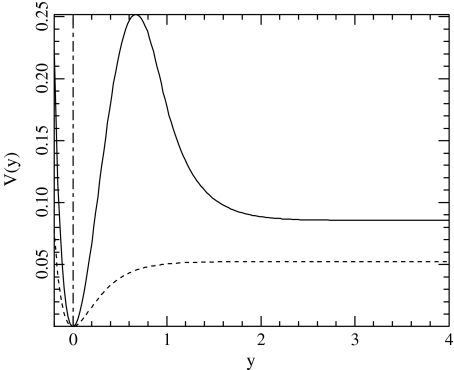
The potential  for α = β = 4.0 Å − 1, E = 4.0 Å − 1 and D = 0.0857 eV ( solid line) and the Morse potential with α = 4.0 Å − 1, D = 0.05254 eV (dotted line) that gives the same melting temperature for the DNA model
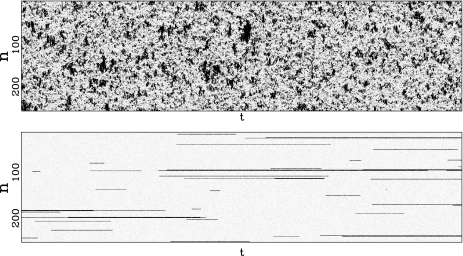
Comparison of the dynamics of the model with the Morse potential V(y) (top figure) and with the modified potential with a hump  (bottom figure) obtained from a numerical simulation of the models in contact with a thermal bath at 270 K. The stretching of the base pairs is shown by a gray scale going from white for a closed pair to black for a fully open pair (y ≥ 2.0 Å). The vertical axis extends along the DNA chain, which has 256 base pairs in these calculations, with periodic boundary conditions. The horizontal axis corresponds to time. The parameters used for this calculation are K = 0.01 eV Å − 2, ρ = 3.0, δ = 0.8 Å − 1, D = 0.05254 eV, α = 4.0 Å − 1 for the Morse potential (top figure) and α = β = 4.0 Å − 1, E = 4.0 Å − 1 and D = 0.0857 eV for the potential
  (bottom figure). The total time shown in these figures is 2 × 10 − 8 s, i.e., 1,000 times longer than for Fig. 4
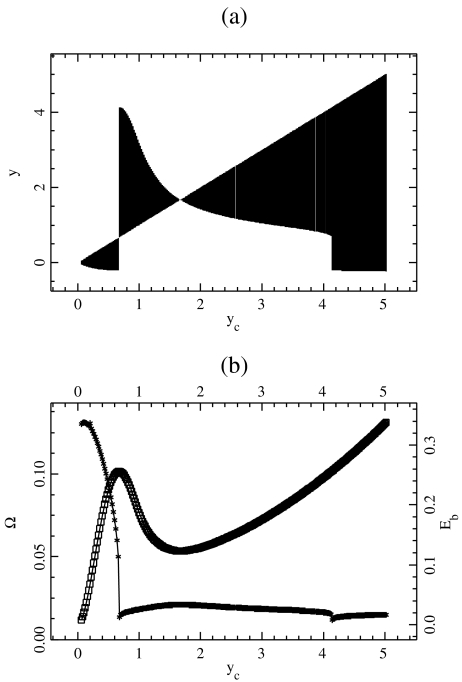
Properties of the localized oscillatory mode created by exciting one particle in the lattice described by Hamiltonian (5). The top figure (a) shows the extrema of the oscillation ymin and ymax as a function of the amplitude  of the excitation. For each value of
  a vertical line is drawn between ymin and ymax. The bottom figure (b) shows the frequency Ω (crosses) and the energy
  (squares) of the breather versus
  . Lengths are in Å, energy in eV, and frequency in 1014 s − 1, which are the units used for the DNA model
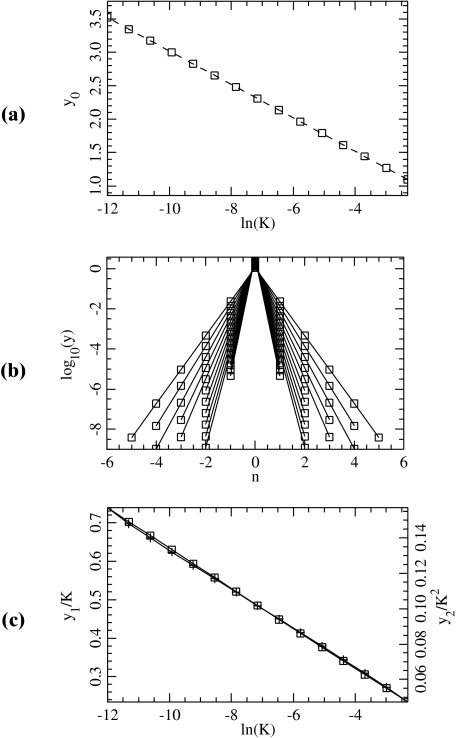
Properties of the static solution for different values of K. a The amplitude y0 as a function of ln (K ) (squares) and the curve y = − (1/β) ln (2 K / Eβ). b The static solution for different values of K in logarithmic scale. Only the positions of the particles near the center of the solution are shown. cy1/K (squares, left scale) and  (crosses, right scale)
References
-
- Wartell, R.M., Benight, A.S.: Thermal denaturation of DNA molecules: a comparison of theory with experiments. Phys. Rep. 126, 67 (1985) - DOI
LinkOut - more resources
Full Text Sources
