. 2009 Oct;18(10):2060-6.
doi: 10.1002/pro.218.

Alteration of oligomeric state and domain architecture is essential for functional transformation between transferase and hydrolase with the same scaffold

Affiliations

Alteration of oligomeric state and domain architecture is essential for functional transformation between transferase and hydrolase with the same scaffold

Ryotaro Koike et al. Protein Sci. 2009 Oct.

Abstract

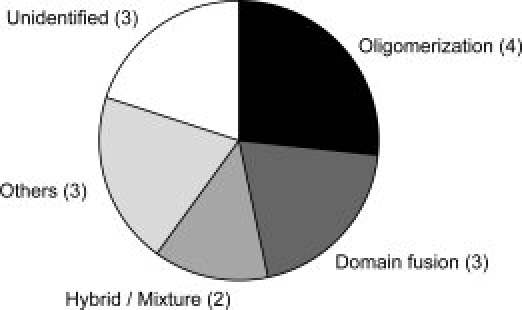
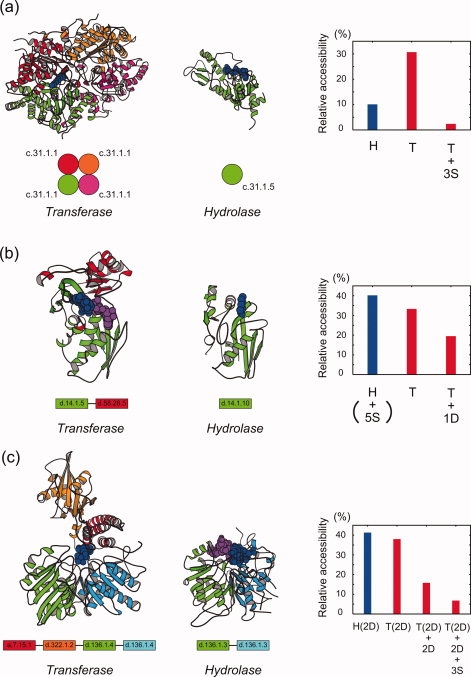
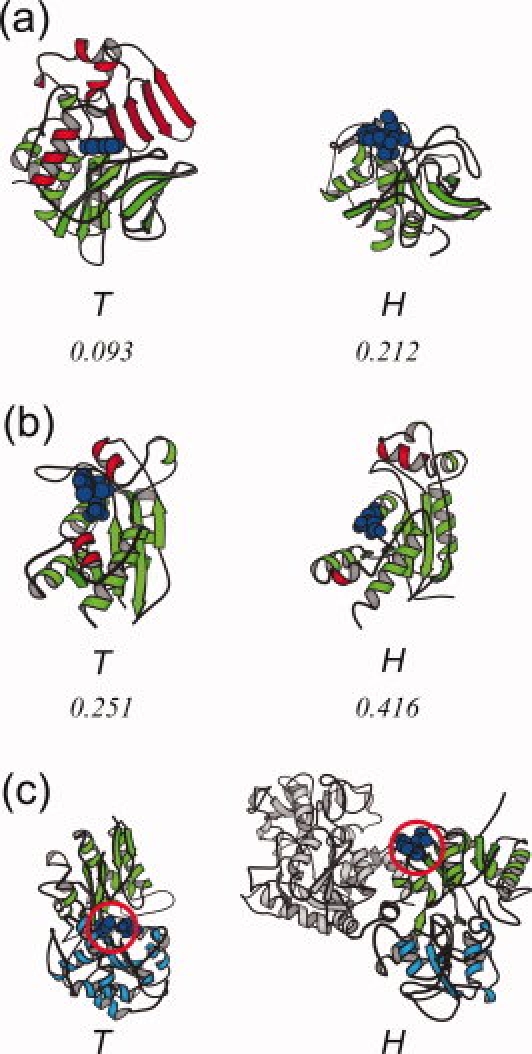
Transferases and hydrolases catalyze different chemical reactions and express different dynamic responses upon ligand binding. To insulate the ligand molecule from the surrounding water, transferases bury it inside the protein by closing the cleft, while hydrolases undergo a small conformational change and leave the ligand molecule exposed to the solvent. Despite these distinct ligand-binding modes, some transferases and hydrolases are homologous. To clarify how such different catalytic modes are possible with the same scaffold, we examined the solvent accessibility of ligand molecules for 15 SCOP superfamilies, each containing both transferase and hydrolase catalytic domains. In contrast to hydrolases, we found that nine superfamilies of transferases use two major strategies, oligomerization and domain fusion, to insulate the ligand molecules. The subunits and domains that were recruited by the transferases often act as a cover for the ligand molecule. The other strategies adopted by transferases to insulate the ligand molecule are the relocation of catalytic sites, the rearrangement of secondary structure elements, and the insertion of peripheral regions. These findings provide insights into how proteins have evolved and acquired distinct functions with a limited number of scaffolds.


Figures

Figure 1
Figure 1
Strategies adopted by the transferases of 15 SCOP superfamilies to insulate ligand molecules. The two major strategies, “oligomerization” and “domain fusion,” were colored by black and dark gray, respectively. In the superfamilies classified into “hybrid/mixture” (gray), both oligomerization and domain fusion were found in the transferases. The three miner strategies, insertion of peripheral regions, relocation of catalytic sites, and rearrangement of secondary structures, were compiled into one strategy, “others” (light gray).
Figure 2
Figure 2
Structures of the representative transferases (left panels) adopting the three major strategies (a, oligomerization; b, domain fusion; c, hybrid), the corresponding structures of the hydrolases (middle panels) and the relative solvent accessibility of the ligand molecules (right panels). (a) The “DHS-like NAD/FAD-binding domain” (c.31.1) superfamily. The homotetrameric form of the transferase, deoxyhypusine synthase [Protein Data Bank (PDB) code: 1rqd, chain A, B, C, D], is shown in the left panel. The monomeric form of the hydrolase, silent information regulator 2 (PDB: 1m2k, chain A), is in the middle panel. Their ligand molecules are depicted by blue CPK models. Ribbon models were drawn by MOLSCRIPT. In the right panel, the relative solvent accessibility of the ligand molecules for the hydrolase and the transferase are shown by blue and red bars, respectively, where “S” stands for the addition of a subunit, and thus “+3S” means a change from monomer to homotetramer. The domain architectures are drawn schematically at the bottom. (b) The “ribosomal protein S5 domain 2-like” (d.14.1) superfamily. The structure of the transferase, 4-diphosphocytidyl-2C-methyl-d-erythritol kinase (PDB: 1oj4, chain A), is in the left panel, with the recruited domain in red. The structure of the hydrolase, Lon protease (PDB: 1rre, chain A), is in the middle panel. The relative solvent accessibility of the ligand molecules of the transferase decreases with the addition of a recruited domain (+1D) (right panel). (c) The “phospholipase D/nuclease” (d.136.1) superfamily. The monomeric form of the transferase, polyphosphate kinase (PDB: 1xdp, chain A), is shown in the left panel. The two recruited domains are colored red and orange, respectively. The structure of the hydrolase, tyrosyl-DNA phosphodiesterase (PDB: 1rff, chain A), is in the middle panel. The relative solvent accessibility of the ligand molecule of the transferase is reduced with the addition of the two recruited domains (+2D), and decreases further upon homotetramer formation (+3S) (right panel).
Figure 3
Figure 3
The structures of the transferases adopting strategies other than those in Figure 2, in comparison with the structures of the hydrolases. (a) The structures of the transferase, arylamine N-acetyltransferase (PDB: 1w6f, chain A), and the hydrolase, cathepsin S (PDB: 2h7j, chain A), belonging to the “cysteine proteinases” (d.3.1) superfamily. The peripheral region (186–275) inserted within the transferase (red) covers the ligand molecule (blue). The values at the bottom indicate the relative solvent accessibility of the ligand molecule. (b) The structures of the transferase, DNA polymerase III epsilon subunit (PDB: 2ido, chain A), and the hydrolase, oligoribonuclease (PDB: 1yta, chain A), of the “ribonuclease H-like” (c.55.3) superfamily. The two helices shown in red (59–67, 144–152) in the transferase cover the ligand molecules. (c) The structures of the transferase, thiaminase I (PDB: 4thi, chain A), and the hydrolase, lactoferrin (PDB: 1lcf, chain A), of the “periplasmic binding protein-like II” (c.94.1) superfamily. In the transferase, the catalytic sites (C113 and E241, blue CPK) are in the middle (red circle) of the two sub-domains (9–113 and 270–354 in green, 114–269 and 355–370 in cyan). On the other hand, in the hydrolase, the catalytic residues are located at K73 and S259, shown in the red circle. The peripheral domain is colored gray. The relative accessibility for the hydrolase is not given, because the ligand-bound form is not available.

References

    1. Branden C, Tooze J. Introduction to protein structure. 2nd ed. New York: Garland Publishing; 1998.
    1. Glasner ME, Gerlt JA, Babbitt PC. Evolution of enzyme superfamilies. Curr Opin Chem Biol. 2006;10:492–497. - PubMed
    1. Hegyi H, Gerstein M. The relationship between protein structure and function: a comprehensive survey with application to the yeast genome. J Mol Biol. 1999;288:147–164. - PubMed
    1. Martin AC, Orengo CA, Hutchinson EG, Jones S, Karmirantzou M, Laskowski RA, Mitchell JB, Taroni C, Thornton JM. Protein folds and functions. Structure. 1998;6:875–884. - PubMed
    1. Nagano N, Orengo CA, Thornton JM. One fold with many functions: the evolutionary relationships between TIM barrel families based on their sequences, structures and functions. J Mol Biol. 2002;321:741–765. - PubMed

Publication types

LinkOut - more resources