

CD8+ T-cell responses to Theileria parva are preferentially directed to a single dominant antigen: Implications for parasite strain-specific immunity
- PMID: 19670382
- PMCID: PMC3149124
- DOI: 10.1002/eji.200939227
CD8+ T-cell responses to Theileria parva are preferentially directed to a single dominant antigen: Implications for parasite strain-specific immunity
Abstract
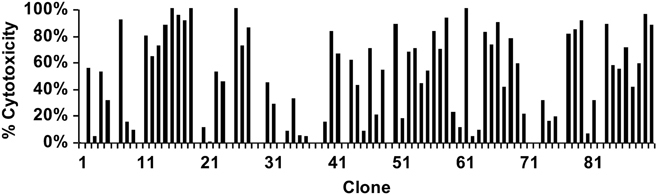
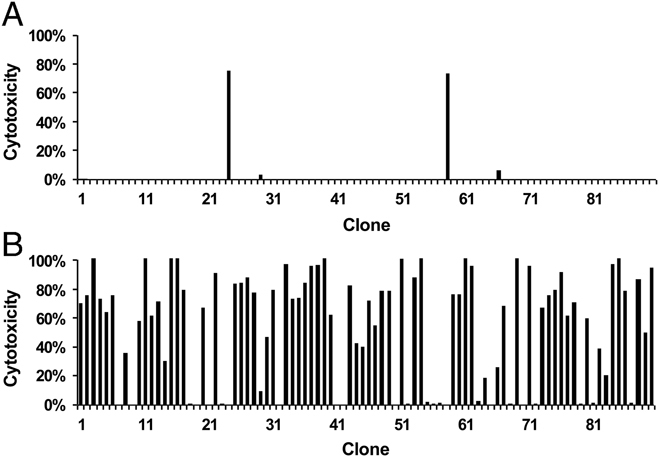
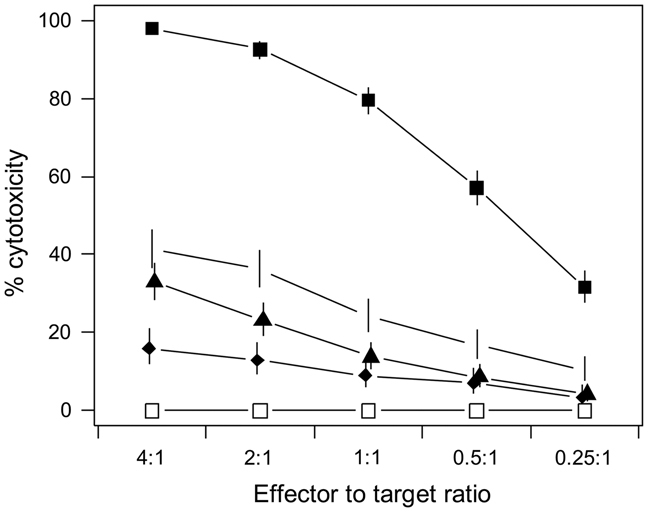
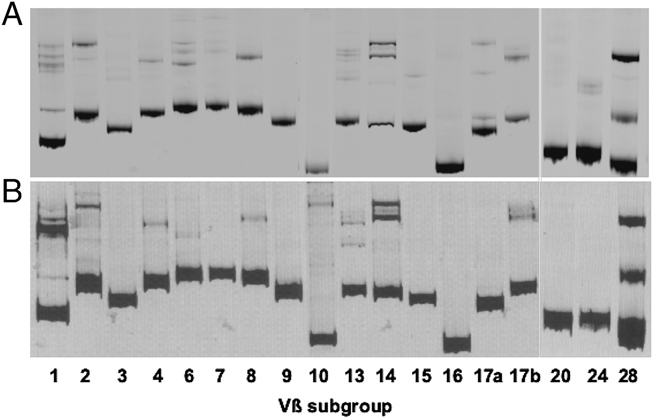
Although immunodominance of CD8(+) T-cell responses is a well-recognised feature of viral infections, its role in responses to more antigenically complex pathogens is less clear. In previous studies we have observed that CD8(+) T-cell responses to Theileria parva exhibit different patterns of parasite strain specificity in cattle of different MHC genotypes. In the current study, we demonstrated that animals homozygous for the A10 and A18 MHC haplotypes have detectable responses to only one of 5 T. parva antigens. Over 60% of the responding T cells from the A18(+) and A10(+) animals recognised defined epitopes in the Tp1 and Tp2 antigens, respectively. Comparison of T-cell receptor beta chain expression profiles of CD8(+) T-cell lines and CD8(+) T cells harvested ex vivo confirmed that the composition of the T-cell lines was representative of the in vivo memory CD8(+) T-cell populations. Analysis of the Tp1 and Tp2 antigens revealed sequence polymorphism, which was reflected by differential recognition by T-cell lines. In conclusion, we have demonstrated a profound immunodominance in the CD8(+) T-cell response to T. parva, which we propose is a major determinant of the parasite strain specificity of the response and hence immune protection.
Figures
Similar articles
-
CD8 T-cell responses against the immunodominant Theileria parva peptide Tp249-59 are composed of two distinct populations specific for overlapping 11-mer and 10-mer epitopes.Immunology. 2016 Oct;149(2):172-85. doi: 10.1111/imm.12637. Epub 2016 Jul 25. Immunology. 2016. PMID: 27317384 Free PMC article.
-
Genes encoding two Theileria parva antigens recognized by CD8+ T-cells exhibit sequence diversity in South Sudanese cattle populations but the majority of alleles are similar to the Muguga component of the live vaccine cocktail.PLoS One. 2017 Feb 23;12(2):e0171426. doi: 10.1371/journal.pone.0171426. eCollection 2017. PLoS One. 2017. PMID: 28231338 Free PMC article.
-
Escape from CD8+ T cell response by natural variants of an immunodominant epitope from Theileria parva is predominantly due to loss of TCR recognition.J Immunol. 2011 Dec 1;187(11):5910-20. doi: 10.4049/jimmunol.1102009. Epub 2011 Nov 4. J Immunol. 2011. PMID: 22058411
-
The biological and practical significance of antigenic variability in protective T cell responses against Theileria parva.Vet Parasitol. 2007 Aug 19;148(1):21-30. doi: 10.1016/j.vetpar.2007.05.007. Epub 2007 Jun 18. Vet Parasitol. 2007. PMID: 17580101 Review.
-
Understanding the basis of parasite strain-restricted immunity to Theileria parva.Annu Rev Anim Biosci. 2015;3:397-418. doi: 10.1146/annurev-animal-022513-114152. Epub 2014 Nov 12. Annu Rev Anim Biosci. 2015. PMID: 25422856 Review.
Cited by
-
Sequence diversity of cytotoxic T cell antigens and satellite marker analysis of Theileria parva informs the immunization against East Coast fever in Rwanda.Parasit Vectors. 2020 Sep 7;13(1):452. doi: 10.1186/s13071-020-04322-9. Parasit Vectors. 2020. PMID: 32894166 Free PMC article.
-
Development of a Potential Yeast-Based Vaccine Platform for Theileria parva Infection in Cattle.Front Immunol. 2021 Jul 8;12:674484. doi: 10.3389/fimmu.2021.674484. eCollection 2021. Front Immunol. 2021. PMID: 34305904 Free PMC article.
-
Ancient diversity and geographical sub-structuring in African buffalo Theileria parva populations revealed through metagenetic analysis of antigen-encoding loci.Int J Parasitol. 2018 Mar;48(3-4):287-296. doi: 10.1016/j.ijpara.2017.10.006. Epub 2018 Feb 3. Int J Parasitol. 2018. PMID: 29408266 Free PMC article.
-
Distinct life history strategies underpin clear patterns of succession in microparasite communities infecting a wild mammalian host.Mol Ecol. 2023 Jul;32(13):3733-3746. doi: 10.1111/mec.16949. Epub 2023 Apr 10. Mol Ecol. 2023. PMID: 37009964 Free PMC article.
-
Whole-genome sequencing of Theileria parva strains provides insight into parasite migration and diversification in the African continent.DNA Res. 2013 Jun;20(3):209-20. doi: 10.1093/dnares/dst003. Epub 2013 Feb 12. DNA Res. 2013. PMID: 23404454 Free PMC article.
References
-
- Wong P, Pamer EG. CD8 T cell responses to infectious pathogens. Annu. Rev. Immunol. 2003;21:29–70. - PubMed
-
- Mason D. A very high level of cross-reactivity is an essential feature of the T cell receptor. Immunol. Today. 1998;19:395–404. - PubMed
-
- Yewdell JW. Confronting complexity: real-world immunodominance in antiviral CD8+ T cell responses. Immunity. 2006;25:533–543. - PubMed
-
- McMichael AJ, Rowland-Jones SL. Cellular immune responses to HIV. Nature. 2001;410:980–987. - PubMed
-
- Yewdell JW, Bennink JR. Immunodominance in major histocompatibility complex class I-restricted T lymphocyte responses. Annu. Rev. Immunol. 1999;17:51–88. - PubMed
Publication types
MeSH terms
Substances
Grants and funding
LinkOut - more resources
Full Text Sources
Other Literature Sources
Molecular Biology Databases
Research Materials
