Comparative Study
. 2009 Sep 29;48(38):9047-60.
doi: 10.1021/bi901078y.

De novo molecular modeling and biophysical characterization of Manduca sexta eclosion hormone

Affiliations
Comparative Study

De novo molecular modeling and biophysical characterization of Manduca sexta eclosion hormone

J Joe Hull et al. Biochemistry. .

Abstract

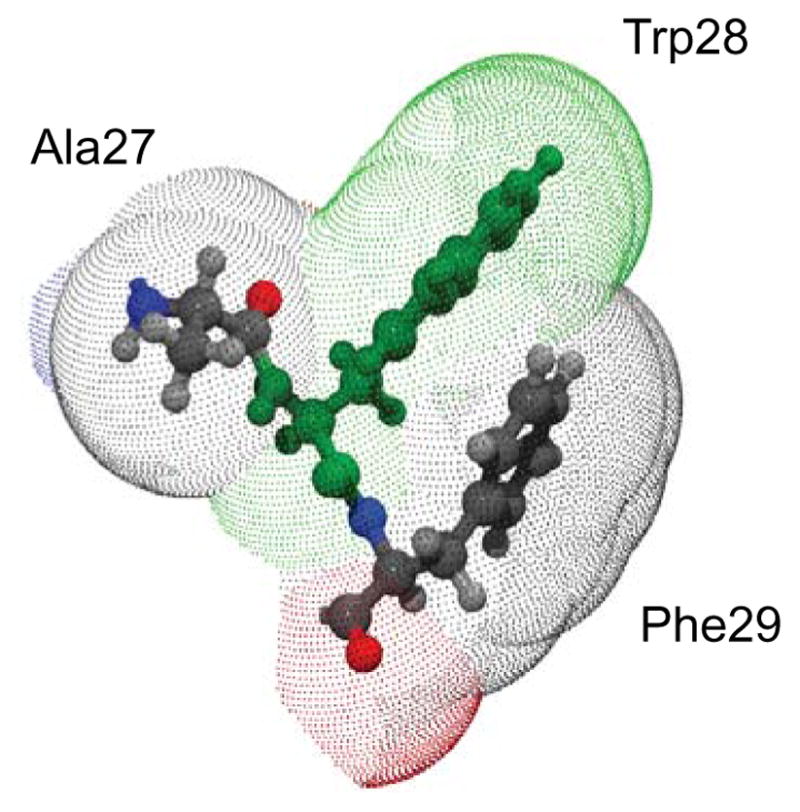
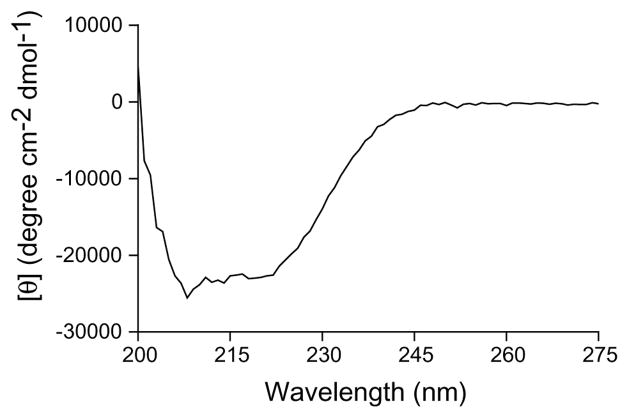
Eclosion hormone (EH) is an integral component in the cascade regulating the behaviors culminating in emergence of an insect from its old exoskeleton. Little is known regarding the EH solution structure; consequently, we utilized a computational approach to generate a hypothetical structure for Manduca sexta EH. The de novo algorithm exploited the restricted conformational space of disulfide bonds (Cys14-Cys38, Cys18-Cys34, and Cys21-Cys49) and predicted secondary structure elements to generate a thermodynamically stable structure characterized by 55% helical content, an unstructured N-terminus, a helical C-terminus, and a solvent-exposed loop containing Trp28 and Phe29. Both the strain and pseudo energies of the predicted peptide compare favorably with those of known structures. The 62-amino acid peptide was synthesized, folded, assayed for activity, and structurally characterized to confirm the validity of the model. The helical content is supported by circular dichroism and hydrogen-deuterium exchange mass spectrometry. Fluorescence emission spectra and acrylamide quenching are consistent with the solvent exposure predicted for Trp28, which is shielded by Phe29. Furthermore, thermodynamically stable conformations that deviated only slightly from the predicted Manduca EH structure were generated in silico for the Bombyx mori and Drosophila melanogaster EHs, indicating that the conformation is not species-dependent. In addition, the biological activities of known mutants and deletion peptides were rationalized with the predicted Manduca EH structure, and we found that, on the basis of sequence conservation, functionally important residues map to two conserved hydrophobic clusters incorporating the C-terminus and the first loop.


Figures

FIGURE 1
FIGURE 1
Alignment of EH sequences. Alignment performed using CLUSTAL W (http://npsa-pbil.ibcp.fr) on 14 of the known EH sequences/fragments with default settings for the gap opening penalty (55). The order of sequences returned by the program approximates the phylogeny. Residues highlighted in black are invariant, whereas conserved residues are highlighted in grey. GenBank accession numbers are listed for sequences obtained from genomic data. Species abbreviations are per NCBI/Swiss Prot: Tenebrio molitor, Tenmo (Horodyski, personal communication and (11); Tribolium castaneum, Trica (XP_969164); Thermobia domestica, Thedo (Horodyski, personal communication and (11); Pediculus humanus corporis, Pedhu (XP_002432310); Acyrthosiphon pisum, Acypi (XP_001943459); Apis mellifera, Apime (XP_001122120); Drosophila pseudoobscura, Drops (EAL27464); Drosophila melanogaster, Drome (CAA51051); Anopheles gambiae, Anoga (9) (XP_001230805); Culex quinquefasciatus, Culqu (XP_001864428); Manduca sexta, Manse (6, 7); Helicoverpa armigera, Helar (12); Ostrinia furnacalis, Ostfu (56); and Bombyx mori, Bommo (8). Lines below the sequences represent the disulfide bonds.
FIGURE 2
FIGURE 2
Predicted secondary structure of Manduca EH. Results from various secondary structure prediction algorithms implemented in the SYBYL software package (M&S, Maxfield-Scheraga (23); GOR, Garnier-Osguthorpe-Robson (22); Q&S, Qian-Sejnowski (24) or algorithms available online (i.e., GOR1, Garnier-Osguthorpe-Robson method 1978; GOR3, Garnier-Osguthorpe-Robson method 1987; PHD, profile-based neural network prediction; and SOPM, self-optimized prediction method) (25). Only those regions predicted to be α-helical (h) are shown. The consensus helical assignments of the starting structure used to generate our model (shown in bold) are based on designations from three or more prediction algorithms.
FIGURE 3
FIGURE 3
Ribbon diagram of the predicted Manduca EH solution structure. Lowest energy conformation of full-length Manduca EH following molecular dynamics simulations and unconstrained energy minimization. Disulfide bonds are indicated in yellow and the helical segments are shown in blue (helix I), green (helix II), and red (helix III). The figure was rendered using the SwissPdb Viewer (57) and POVRay3.5.
FIGURE 4
FIGURE 4
Predicted solvent exposed surface of Trp28. The dots represent the solvent exposed surfaces of Ala27, Trp28, and Phe29 in Manduca EH. The individual residues are depicted in ball-and-stick configuration with Ala27 and Phe29 shown in CPK coloring and Trp28 in green.
FIGURE 5
FIGURE 5
CD spectra of synthetic Manduca EH. Data were recorded at room temperature in 10 mM sodium phosphate buffer at pH 6.7 with 2 μM synthetic Manduca EH.
FIGURE 6
FIGURE 6
Main chain amide protons involved in intramolecular hydrogen bonds. A) Kinetic profile of hydrogen-deuterium exchange for 40 nM synthetic Manduca EH at pH 6.7. Data were obtained following incubation in D2O for 1 min to 120 min. The solid line represents the best fit curve for the exchange reaction (goodness of fit of R2 = 0.99), the dashed line indicates the maximum number of observable hydrogen-deuterium exchange sites. B) The location of main chain amide protons predicted to be involved in intramolecular hydrogen bonds have been mapped onto the predicted Manduca EH structure and are shown in blue, those not involved are shown in white.
FIGURE 7
FIGURE 7
Intrinsic fluorescence spectra for 1 μM synthetic Manduca EH. The fluorescence spectrum was recorded from 300–400 nm with excitation at 288 nm. EH (dashed line) exhibited an emission maximum at 351 nm. Both controls, NAWA (solid line) and NAWA/NAYA mixture (1:1; dotted line) exhibited emission maxima at 356 nm.
FIGURE 8
FIGURE 8
Fluorescence quenching by acrylamide. A) Stern-Volmer plot. The calculated Ksv constants were: 10.1 ± 0.5 M−1 for Manduca EH, 26.1 ± 2.1 M−1 for NAWA, and 25.2 ± 1.0 M−1 for the NAWA/NAYA mixture. Inset. Decrease in fluorescence intensity of each as a function of increasing acrylamide concentration. B) Lehrer plot. All three samples exhibited similar y-intercepts of near 1, indicating that the Trp28 indole moiety does not oscillate between buried and exposed states. The fluorescence spectrum was recorded at 350 nm with excitation at 295 nm. Data were corrected for buffer effect, acrylamide Abs295, and the dilution. Results shown are mean ± S.E.M. of triplicate values and are from a single experiment representative of three independent experiments. Error bars are not visible as they are smaller than the size of the symbols. NAWA (open squares), NAWA/NAYA mixture (open circles), Manduca EH (closed triangles).
FIGURE 9
FIGURE 9
Evaluation of differing helical assignments. (A) Alignment of Manduca EH conformations after minimization in the presence of differing helical constraints. Snapshot of the ending Manduca EH molecules generated from a 20 ps molecular dynamics simulation performed in the presence of weak ϕ/ψ constraints on residues 11-24, 34-41, and 48-61 (our predicted helical assignments; green) or residues 9-24, 34-40, and 49-55 (the reported Bombyx helical assignments; yellow). An unconstrained Manduca EH molecule is shown in red. (B) Pseudo energies mapped onto tube representations of Manduca EH conformations after minimization in the presence of differing helical constraints. Middle, unconstrained peptide; left, peptide in presence of strong ϕ/ψ constraints (residues 9-24, 34-40 and 49-55 from the reported Bombyx helices); right, peptide with strong ϕ/ψ constraints on residues 11-24, 34-41, and 48-61 from our initial predicted helical assignments. The coloring and size of the tube representations have been scaled to indicate the location of favorable (violet > blue, small diameter) and unfavorable (red > orange, large diameter) pseudo energies. The cystines are shown in stick format.
FIGURE 10
FIGURE 10
Distribution of hydrophobic potentials. View of the hydrophobic potentials at the solvent accessible Connolly surfaces (radius of 1.4 Å) of Manduca EH (right), Drosophila EH (middle), and Bombyx EH (left). Hydrophobicity scaling has been normalized to the lowest and highest global values and decreases from brown (hydrophobic) to blue (polar) with green indicative of intermediate potentials. Regions that exhibit similarity amongst the three peptides have been labeled (A) the hydrophobic residues clustered at the C-terminus, and (B) the loop region containing the solvent exposed Trp28 (Tyr in Drosophila) and Phe29.
FIGURE 11
FIGURE 11
Location of some residues essential for biological activity. The predicted solution structure of Manduca EH with helices indicated in blue (helix I), dark green (helix II), and red (helix III). Residues (shown in ball-and-stick format) previously purported to interact with the receptor are shown in yellow (Met24, Phe29, Ile55). Phe58 and Leu59 (both shown in blue) are solvent exposed and crucial for receptor interaction (our data). Leu25 (pink) is > 14Å from Phe58. The solvent accessible surfaces of the individual residues are represented by the light grey dots. The figure was rendered using the SwissPdb Viewer (57) and POVRay3.5.
FIGURE 12
FIGURE 12
Effects of Gly mutations on the solvent accessible surface properties of Ile55, Phe58, and Leu59. (A) Hydrophobic potentials. Hydrophobicity scaling has been normalized to the lowest and highest global values with regions of high hydrophobicity shown in brown, polar regions in blue, while areas of intermediate potentials are shown in green. The hydrophobic potential reflects the contribution of the surrounding residues whose surfaces have not been shown for clarity. (B) Local surface topography. The degree of surface curvature is shown projected on to the solvent accessible surfaces of Ile55, Phe58, and Leu59 with concave regions in blue, convex regions in brown to white, and intermediate regions in green. Differences in the surface topography reflect changes in the chi1 torsion angles following Gly substitution. Peptides have been aligned to the backbone atoms of residues 55, 58, and 59.

Similar articles

Cited by

References

    1. Truman JW. Hormonal control of insect ecdysis: endocrine cascades for coordinating behavior with physiology. Vitam Horm. 2005;73:1–30. - PubMed
    1. Truman JW, Taghert PH, Copenhaver PF, Tublitz NJ, Schwartz LM. Eclosion hormone may control all ecdysis in insects. Nature. 1981;291:70–71.
    1. Truman JW. The eclosion hormone system of insects. Prog Brain Res. 1992;92:361–374. - PubMed
    1. Baker JD, McNabb SL, Truman JW. The hormonal coordination of behavior and physiology at adult ecdysis in Drosophila melanogaster. J Exp Biol. 1999;202:3037–3048. - PubMed
    1. McNabb SL, Baker JD, Agapite J, Steller H, Riddiford LM, Truman JW. Disruption of a behavioral sequence by targeted death of peptidergic neurons in Drosophila. Neuron. 1997;19:813–823. - PubMed

Publication types

MeSH terms