. 2009 Oct 1;114(14):2936-44.
doi: 10.1182/blood-2009-05-220111. Epub 2009 Aug 11.

Monocytes promote tumor cell survival in T-cell lymphoproliferative disorders and are impaired in their ability to differentiate into mature dendritic cells

Affiliations

Monocytes promote tumor cell survival in T-cell lymphoproliferative disorders and are impaired in their ability to differentiate into mature dendritic cells

Ryan A Wilcox et al. Blood. .

Abstract

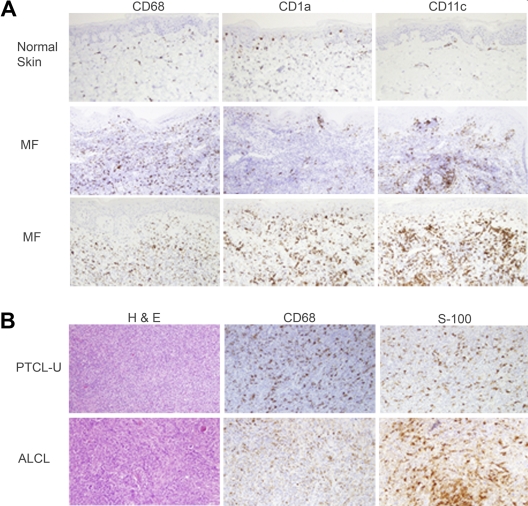
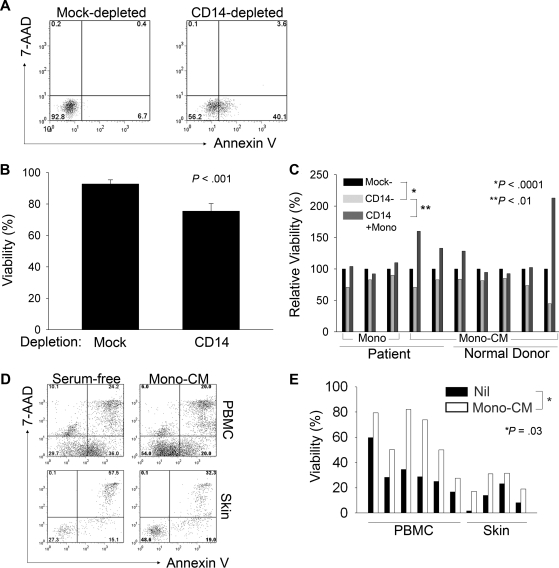
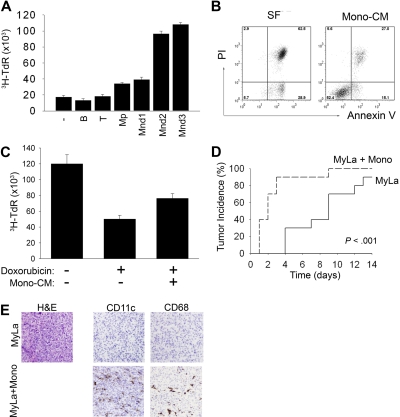
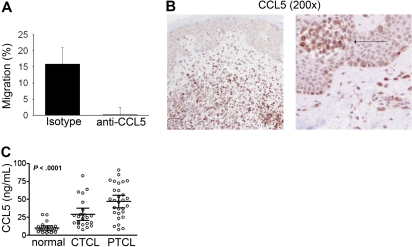
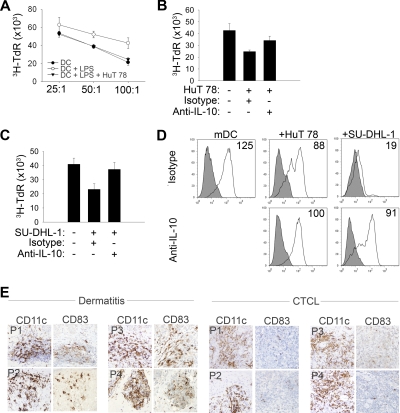
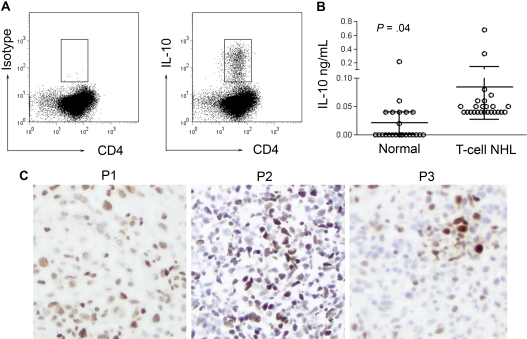
A variety of nonmalignant cells present in the tumor microenvironment promotes tumorigenesis by stimulating tumor cell growth and metastasis or suppressing host immunity. The role of such stromal cells in T-cell lymphoproliferative disorders is incompletely understood. Monocyte-derived cells (MDCs), including professional antigen-presenting cells such as dendritic cells (DCs), play a central role in T-cell biology. Here, we provide evidence that monocytes promote the survival of malignant T cells and demonstrate that MDCs are abundant within the tumor microenvironment of T cell-derived lymphomas. Malignant T cells were observed to remain viable during in vitro culture with autologous monocytes, but cell death was significantly increased after monocyte depletion. Furthermore, monocytes prevent the induction of cell death in T-cell lymphoma lines in response to either serum starvation or doxorubicin, and promote the engraftment of these cells in nonobese diabetic/severe combined immunodeficient mice. Monocytes are actively recruited to the tumor microenvironment by CCL5 (RANTES), where their differentiation into mature DCs is impaired by tumor-derived interleukin-10. Collectively, the data presented demonstrate a previously undescribed role for monocytes in T-cell lymphoproliferative disorders.


Figures

Figure 1
Figure 1
T-cell lymphoproliferative disorders are associated with a rich infiltrate of monocyte-derived cells. Normal skin and biopsies obtained from CTCL patients with mycosis fungoides (A) or lymph node biopsies from patients with PTCL (B) were stained for monocyte-derived macrophages (CD68) or dendritic cells (CD1a, CD11c, S-100). Representative examples (CTCL, n = 10; PTCL, n = 12) are shown (×200).
Figure 2
Figure 2
Monocytes promote survival of malignant T cells. (A-E) Cells were stained with annexin V and 7-AAD and viability of Sézary cells (SCs) was reported. PBMCs were either mock or CD14 depleted (A-C) and cultured for approximately 7 days before staining. Malignant T cells were identified by staining for the appropriate T-cell receptor (TCR) Vβ chain. For samples in which TCR Vβ use was unknown, malignant CD4+ T cells were identified by the aberrant down-regulation of CD7. The data shown in panel B represent the mean ± SD of 4 independent samples. (C) CD14-depleted samples were supplemented with either purified autologous monocytes (first 3 samples shown, indicated by “mono”) or with supernatants (ie, monocyte-conditioned media; last 7 samples shown, indicated by “Mono-CM”) derived from cultured patient-derived monocytes or with monocyte-conditioned media (mono-CM) derived from normal donor monocytes, as indicated. (D) SCs derived from PBMCs or skin from the same patient were cultured in serum-free media supplemented with autologous mono-CM and viability of CD4+CD7 SCs was determined by annexin V and 7-AAD staining. (E) Total PBMCs (n = 6) or skin-infiltrating lymphocytes (n = 4) were cultured in serum-free (SF) conditions (■) or in SF media supplemented with 40% mono-CM (□) and viability of CD4+CD7 malignant T cells was determined, as described for panel D.
Figure 3
Figure 3
Monocytes prevent chemotherapy-induced cell death and promote tumor engraftment in a human xenograft model. (A) HuT 78 cells were cultured in serum-free media alone, in B cell–conditioned media, T cell–conditioned media, patient mono-CM (Mp), or mono-CM obtained from 3 normal donors (Mnd), and thymidine incorporation was determined 72 hours later (mean ± SD). (B) HuT 78 cells in SF or mono-CM were stained with annexin V/PI and viability was determined 48 hours later. (C) HuT 78 cells were cultured in media alone or in media supplemented with mono-CM, and doxorubicin was added at the concentration (80 ng/mL) that inhibited thymidine incorporation at 72 hours by approximately 50%. Data shown are representative of at least 3 independently performed experiments (mean ± SD). (D) MyLa cells, alone or combined with purified monocytes (ratio 1:1), were injected subcutaneously into the flanks of NOD-SCID mice (each group n = 10). Tumors were considered established when the average tumor diameter reached at least 3 mm. Data shown are representative of 4 similarly performed experiments. (E) Tumors were harvested from both groups of mice and immunohistochemistry was performed for markers (CD11c, CD68) expressed by monocyte-derived cells (×200).
Figure 4
Figure 4
CCL5, produced by malignant T cells, attracts monocytes to the tumor microenvironment. (A) MyLa-conditioned media were used to attract monocytes in a 3-hour chemotaxis assay. An isotype control or neutralizing anti-CCL5 antibody was included in the assay, and spontaneous monocyte migration in response to media alone was subtracted from the data shown. Data shown are representative of at least 3 similarly performed experiments (mean ± SD). (B) Skin biopsies from CTCL patients (n = 10) were stained for CCL5. Two representative examples are shown, including an intraepidermal nest of malignant T cells (ie, Pautrier microabscess, indicated by [→]). (C) CCL5 was measured in plasma obtained from both normal donors (n = 24), and from patients with CTCL (n = 23) or PTCL (n = 29). Mean values ± 95% confidence intervals are shown; P < .001.
Figure 5
Figure 5
Malignant T cells inhibit DC maturation in an IL-10–dependent fashion. (A) Immature DCs (iDCs) were generated from monocytes and LPS (1 μg/mL) was added for the last 24 hours of culture to generate mature DCs (mDCs). A group of DCs was cocultured with HuT 78 cells 24 hours before LPS maturation. CD11c+ DCs were purified and iDCs, mDCs, or DCs that had been cocultured with HuT 78 cells before LPS maturation were used to stimulate proliferation of purified CD4+ T cells at the T-cell/DC ratios shown. (B-C) DCs were generated, matured with LPS, and used as stimulators in an allo-mixed lymphocyte reaction at a T-cell/DC ratio of 100:1. As in panel A, before maturation, groups of DCs were cocultured with either HuT 78 (B) or SU-DHL-1 (C) cells in the presence of an isotype control or neutralizing IL-10 monoclonal antibody (2 μg/mL), as indicated. Data are mean ± SD. (D) DCs were generated and matured with LPS in the presence or absence of HuT 78 or SU-DHL-1 cells, as indicated. An isotype control or neutralizing IL-10 antibody was included. Cells were stained with an isotype control (shaded) or anti-CD83 (solid line). Only CD11c+ cells were gated and included in the analysis. Mean fluorescent intensity (MFI) for CD83 is shown in each histogram. Data shown (A-D) are representative of at least 3 similarly performed experiments. (E) Benign dermatitis (n = 10) and CTCL (n = 10) skin biopsies were immunohistochemically stained for both CD11c and CD83. Four representative examples of each are shown.
Figure 6
Figure 6
Malignant T cells produce IL-10 and STAT-3 is phosphorylated within the tumor microenvironment. (A) PBMCs obtained from CTCL patients were cultured in the presence of PMA, ionomycin, and brefeldin A. Malignant T cells were identified as before and intracellular staining for IL-10 was performed. A representative example is shown (n = 2). (B) Plasma was obtained from normal donors (n = 24) and T-cell NHL patients (n = 25) and IL-10 levels were determined (mean ± 95% confidence interval is shown; P = .04). (C) Immunohistochemical analysis of pSTAT3 expression in CTCL biopsy specimens was performed (n = 10). Three representative examples are shown (×200).

References

    1. Whiteside TL. The tumor microenvironment and its role in promoting tumor growth. Oncogene. 2008;27(45):5904–5912. - PMC - PubMed
    1. Bergers G, Benjamin LE. Tumorigenesis and the angiogenic switch. Nat Rev Cancer. 2003;3(6):401–410. - PubMed
    1. Lenz G, Wright G, Dave SS, et al. Stromal gene signatures in large-B-cell lymphomas [see comment]. N Engl J Med. 2008;359(22):2313–2323. - PMC - PubMed
    1. Dave SS, Wright G, Tan B, et al. Prediction of survival in follicular lymphoma based on molecular features of tumor-infiltrating immune cells [see comment]. N Engl J Med. 2004;351(21):2159–2169. - PubMed
    1. Galon J, Costes A, Sanchez-Cabo F, et al. Type, density, and location of immune cells within human colorectal tumors predict clinical outcome [see comment]. Science. 2006;313(5795):1960–1964. - PubMed

Publication types

MeSH terms