. 2009 Aug 12;4(8):e6594.
doi: 10.1371/journal.pone.0006594.

The Wnt receptor, Lrp5, is expressed by mouse mammary stem cells and is required to maintain the basal lineage

Affiliations

The Wnt receptor, Lrp5, is expressed by mouse mammary stem cells and is required to maintain the basal lineage

Nisha M Badders et al. PLoS One. .

Abstract

Background: Ectopic Wnt signaling induces increased stem/progenitor cell activity in the mouse mammary gland, followed by tumor development. The Wnt signaling receptors, Lrp5/6, are uniquely required for canonical Wnt activity. Previous data has shown that the absence of Lrp5 confers resistance to Wnt1-induced tumor development.

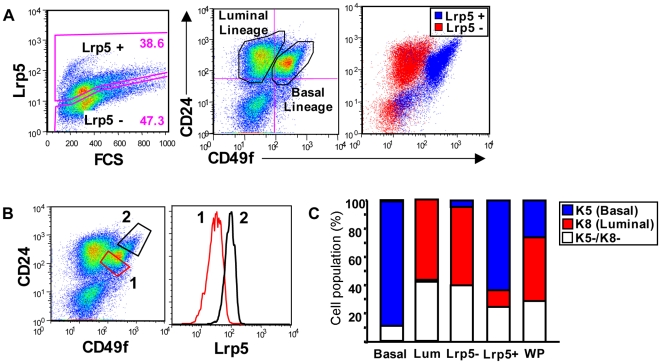
Methodology/principal findings: Here, we show that all basal mammary cells express Lrp5, and co-express Lrp6 in a similar fashion. Though Wnt dependent transcription of key target genes is relatively unchanged in mammary epithelial cell cultures, the absence of Lrp5 specifically depletes adult regenerative stem cell activity (to less than 1%). Stem cell activity can be enriched by >200 fold (over 80% of activity), based on high Lrp5 expression alone. Though Lrp5 null glands have apparent normal function, the basal lineage is relatively reduced (from 42% basal/total epithelial cells to 22%) and Lrp5-/- mammary epithelial cells show enhanced expression of senescence-associated markers in vitro, as measured by expression of p16(Ink4a) and TA-p63.

Conclusions/significance: This is the first single biomarker that has been demonstrated to be functionally involved in stem cell maintenance. Together, these results demonstrate that Wnt signaling through Lrp5 is an important component of normal mammary stem cell function.


Conflict of interest statement

Competing Interests: The authors have declared that no competing interests exist.

Figures

Figure 1
Figure 1. Lrp5 is Expressed in Mouse Mammary Epithelial Cells.
A) Western blot of lysates prepared from E10-12 Lrp5 +/+ and −/− embryos, primary MECs, and the NMuMG and HC11 cell lines. B) Northern blots of RNA prepared from E18 Lrp5 +/+, +/−, −/− embryos, primary virgin (V) and 14 day pregnant (P) MECs, NMuMG and HC11 cell lines were probed for either Lrp5 or Lrp6 mRNA expression. 18S was used as a loading control. C) Immunohistochemistry was used to localize Lrp5-expressing cells in virgin Lrp5 +/+ and −/− paraffin embedded mammary glands. Lrp5 (green) was co-localized with K5 or SMA (red), and nuclei stained with ToPro3 (blue) as indicated, scale bars = 20 µm. Insets depict 5×enlargements, scale bars = 4 µm. D) Frozen sections of 10 day pregnant mammary glands from Lrp5 +/+ and −/− mice were subjected to the same analysis, scale bars = 20 µm.
Figure 2
Figure 2. Lrp5 is Expressed by Basal Mammary Epithelial Cells.
A) BALB/c virgin MECs were stained with CD24, CD49f, and Lrp5 prior to FACS analysis. MECs were gated for positive (blue) and negative (red) Lrp5 expression and the subsequent CD24/CD49f profile of the populations were overlaid. B) Basal MECs were gated based on the magnitude of CD24/CD49f expression level, as CD24low/CD49flow (1, red) or CD24high/CD49fhigh (2, black). The relative Lrp5 expression levels of each population were then overlaid as histograms. C) Basal, Luminal, Lrp5+, Lrp5-, and whole population (WP) MEC fractions (gates show in A) were isolated by FACS and subsequently stained for K5 and K8 to confirm their purity and cellular phenotype.
Figure 3
Figure 3. Lrp6 is co-expressed by Basal Mammary Epithelial Cells.
A) BALB/c virgin MECs were stained with CD24, CD49f, and Lrp6 prior to FACS analysis. MECs were divided into Lrp6+/high and Lrp6-/low, and these populations were overlaid onto the CD24/CD49f profile (Lrp6+ in blue, Lrp6- in red). B) Basal MECs were analyzed as described in Fig. 2b, to test the magnitude of Lrp6 expression relative to CD24/CD49f. C) Lrp6+, Lrp6-, and whole population (WP) MEC fractions were isolated by FACS and subsequently stained for K5 and K8 to determine their cellular phenotype.
Figure 4
Figure 4. Lrp5 is Expressed by Cells that Co-Purify with Stem Cells by Flow Cytometry.
A) Single cell preparations of virgin BALB/c MECs were stained with CD24, CD49f, CD45, and CD31, in addition to Lrp5 prior to FACS analysis. Gates were set to distinguish Lrp5 negative (red), low (blue), and high (green) expressing MECs. The CD24/CD49f profiles for each population were then overlaid. Arrow in Lrp5 high panel indicates previously uncharacterized region of CD24/CD49f profile. B) MECs were stained with von Willebrand factor (VWB), in addition to CD49f and CD24. Gates were drawn to indicate VWB positive and negative populations and the CD24/CD49f profiles were plotted for each respective population. Arrow indicates VWB+ cell population that co-localizes with a fraction of Lrp5 high MECs shown in A. C) Lrp5+ and Lrp5- MEC fractions were isolated by FACS and stained for Vimentin and VWB expression.
Figure 5
Figure 5. Lrp5-High Cells are Enriched for Stem Cell Activity.
A) Mammary epithelial cells were isolated from 10-week, virgin BALB/c mice, stained for Lrp5 and FACS sorted, as described above. Lrp5 high (red) and negative (green) MECs were then transplanted into cleared fat pads of 3-week BALB/c recipient mice. Following 8 weeks, mammary glands were harvested, carmine stained, and scored for primary outgrowths, as described above. Transplantations of the MRU sub-population (black), in addition to the FACS sorted, unfractionated population (Whole Population, gray) served as controls. Left panel is a representative CD24/CD49f FACS profile, depicting overlaid Lrp5- (red), Lrp5 low (blue), and Lrp5 high (green) populations. B) Estimation of stem cell frequencies for each transplanted population. Stem cell frequencies, fold enrichment, and p values were calculated using limdil software (http://bioinf.wehi.edu.au/software/limdil).
Figure 6
Figure 6. In Lrp5 Null Glands, the Basal Cell Population is Depleted.
A) FACS analysis of Lrp5 +/+, −/−, and MMTV-Wnt1 MECs stained with CD49f and CD24. Gates were drawn to indicate the luminal and basal lineages. Right panel, quantification of the ratio of basal to luminal cells from three independent FACS analyses of CD24/CD49f profiles, shown in left panel. B) Western analysis of lysates prepared from uncultured Lrp5 +/+, −/−, and MMTV-Wnt1 MECs. Blots were probed with the basal cell marker, K5, and re-probed with tubulin, as a loading control. C) Representative heatmap and statistical analysis of basal markers from microarray of Lrp5 +/+ and −/− MECs. Samples were analyzed by GeneSifter software and compared by t-test, *p<0.05. D) Immunofluorescent staining of cultured Lrp5 +/+ and −/− MECs. Cells were cultured for 3 days in normal culture media and stained for K8 (red), SMA (green), and DNA (blue), scale bars = 20 µm. Insets depict 5×enlargements, scale bars = 4 µm. The number of large, flattened SMA positive cells were quantified from several fields of immunofluorescent staining of Lrp5 +/+ and −/− cultured MECs from two independent experiments. E) Quantification of p16Ink4a mRNA levels from Lrp5 +/+ and −/− MECs, after 3 days of culture. F) Quantification of p16Ink4a mRNA expression levels of purified luminal and basal Lrp5 +/+ and −/− MECs after culture. mRNA levels were normalized to the housekeeping genes, TBP and HPRT. Normalized expression = 2−ΔCt (see Methods S1). G) Quantification of TA-p63 and ΔN-p63 mRNA expression levels of uncultured Lrp5+/+, −/−, and MMTV-Wnt1 MECs. Data is expressed as fold change over Lrp5 +/+. Data were compared by Wilcoxon Rank Sum Test. Significance was established at p<0.05.
Figure 7
Figure 7. Wnt Signaling of Whole Populations is not Significantly Affected by the Absence of Lrp5.
A) Quantification of Lrp5 and Lrp6 mRNA levels in Lrp5 +/+ and −/− MECs. B) Quantification of expression of the Wnt target gene, Axin2, mRNA in Lrp5 +/+ and −/− MECs. C) Quantification of Axin2 and Gpr49 mRNA expression levels in Lrp5 +/+ and −/− MECs treated with Wnt3a or control conditioned media. All samples were cultured for three days and mRNA levels were normalized to the expression of the housekeeping genes, TBP and HPRT (as described in the Methods section). Normalized expression = 2−ΔCt (see Methods S1). Data shown in A were compared by unpaired Student's t-test. Data shown in B and C were compared by Wilcoxon Rank Sum Test. Significance was established at p<0.05.

References

    1. Klaus A, Birchmeier W. Wnt signalling and its impact on development and cancer. Nat Rev Cancer. 2008;8:387–398. - PubMed
    1. Brennan KR, Brown AM. Wnt proteins in mammary development and cancer. J Mammary Gland Biol Neoplasia. 2004;9:119–131. - PubMed
    1. Cadigan KM, Nusse R. Wnt signaling: a common theme in animal development. Genes Dev. 1997;11:3286–3305. - PubMed
    1. Huelsken J, Birchmeier W. New aspects of Wnt signaling pathways in higher vertebrates. Curr Opin Genet Dev. 2001;11:547–553. - PubMed
    1. Katoh M. WNT signaling in stem cell biology and regenerative medicine. Curr Drug Targets. 2008;9:565–570. - PubMed

Publication types

Substances