

Cardiovascular response to beta-adrenergic blockade or activation in 23 inbred mouse strains
- PMID: 19672458
- PMCID: PMC2722085
- DOI: 10.1371/journal.pone.0006610
Cardiovascular response to beta-adrenergic blockade or activation in 23 inbred mouse strains
Abstract
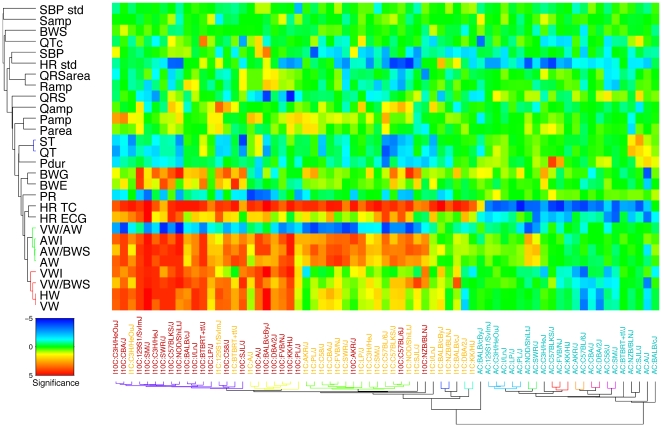
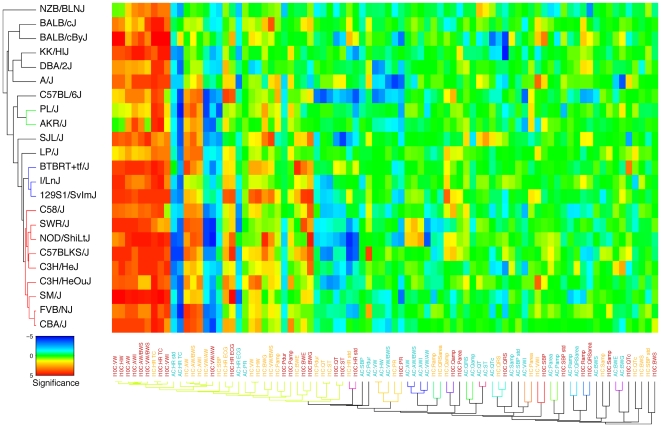
We report the characterisation of 27 cardiovascular-related traits in 23 inbred mouse strains. Mice were phenotyped either in response to chronic administration of a single dose of the beta-adrenergic receptor blocker atenolol or under a low and a high dose of the beta-agonist isoproterenol and compared to baseline condition. The robustness of our data is supported by high trait heritabilities (typically H(2)>0.7) and significant correlations of trait values measured in baseline condition with independent multistrain datasets of the Mouse Phenome Database. We then focused on the drug-, dose-, and strain-specific responses to beta-stimulation and beta-blockade of a selection of traits including heart rate, systolic blood pressure, cardiac weight indices, ECG parameters and body weight. Because of the wealth of data accumulated, we applied integrative analyses such as comprehensive bi-clustering to investigate the structure of the response across the different phenotypes, strains and experimental conditions. Information extracted from these analyses is discussed in terms of novelty and biological implications. For example, we observe that traits related to ventricular weight in most strains respond only to the high dose of isoproterenol, while heart rate and atrial weight are already affected by the low dose. Finally, we observe little concordance between strain similarity based on the phenotypes and genotypic relatedness computed from genomic SNP profiles. This indicates that cardiovascular phenotypes are unlikely to segregate according to global phylogeny, but rather be governed by smaller, local differences in the genetic architecture of the various strains.
Conflict of interest statement
Figures
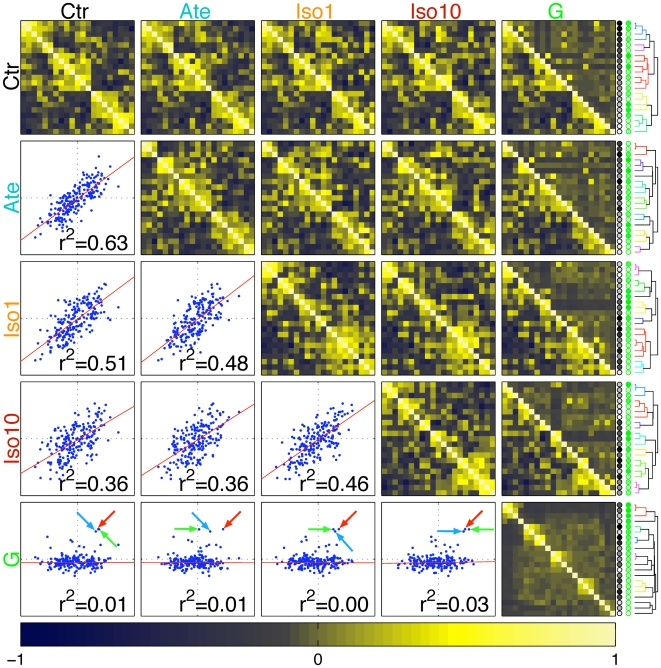
 (where k = ctr, ate, iso1, iso10, or G) across all phenoypes or SNPs (k = G) are shown. Similar strains are placed close to each other and their order is indicated by the coloured circles and dendrograms displayed on the right as determined by standard hierarchical clustering. Above these five matrices ten composite matrices are shown whose lower left part consists of the correlation matrix shown on the main diagonal to the left, while their upper right contains the correlations from the dataset indicated on top, using the same order of strains (i.e. the rows of all adjacent correlation matrices correspond to a fixed strain). The degrees of correlations are indicated by a colour code. In the scatter plots below the diagonal, each pair of strains (s,s') is represented by a dot whose coordinates are given by the correlations
 and
and  where k and k' are indicated on the left and top, respectively. The correlation r2 between these dots is indicated and a red line shows the best linear fit. Blue arrow: C3H/HeJ vs CBA/J, red arrow: 129S1/SvImJ vs LP/J, green arrow: C57BL76J vs C57BLKS/J.
References
-
- Hollenberg NK. The role of beta-blockers as a cornerstone of cardiovascular therapy. Am J Hypertens. 2005;18:165S–168S. 10.1016/j.amjhyper.2005.09.010. - PubMed
-
- Prenner BM. Role of long-acting beta2-adrenergic agonists in asthma management based on updated asthma guidelines. Curr Opin Pulm Med. 2008;14:57–63. 10.1097/MCP.0b013e3282f27121. - PubMed
-
- Wilkinson GR. Drug metabolism and variability among patients in drug response. N Engl J Med. 2005;352:2211–2221. - PubMed
Publication types
MeSH terms
Substances
LinkOut - more resources
Full Text Sources
Molecular Biology Databases
