. 2009 Aug;30(4):611-24.
doi: 10.1111/j.1460-9568.2009.06863.x. Epub 2009 Aug 10.

Development of epileptiform excitability in the deep entorhinal cortex after status epilepticus

Affiliations

Development of epileptiform excitability in the deep entorhinal cortex after status epilepticus

Denis E Bragin et al. Eur J Neurosci. 2009 Aug.

Abstract

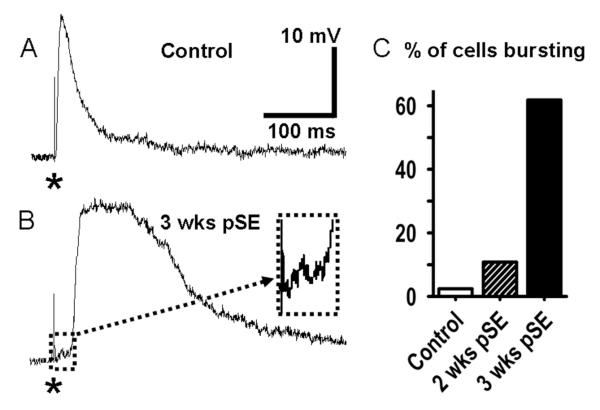
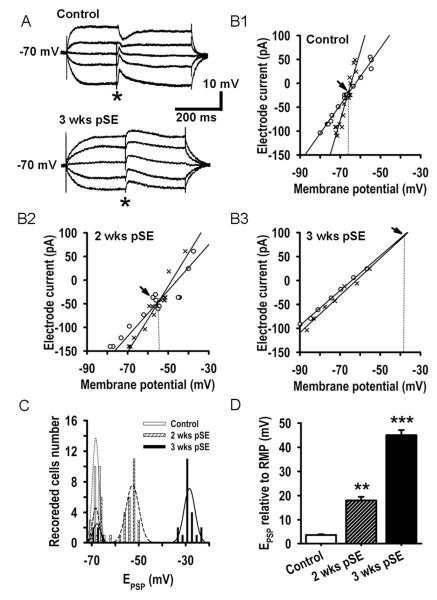
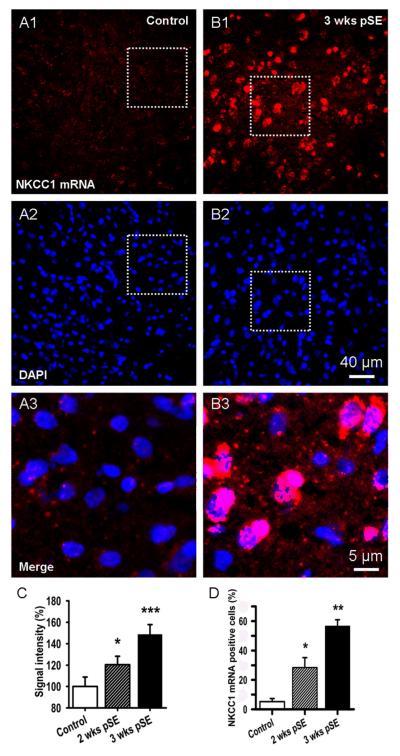
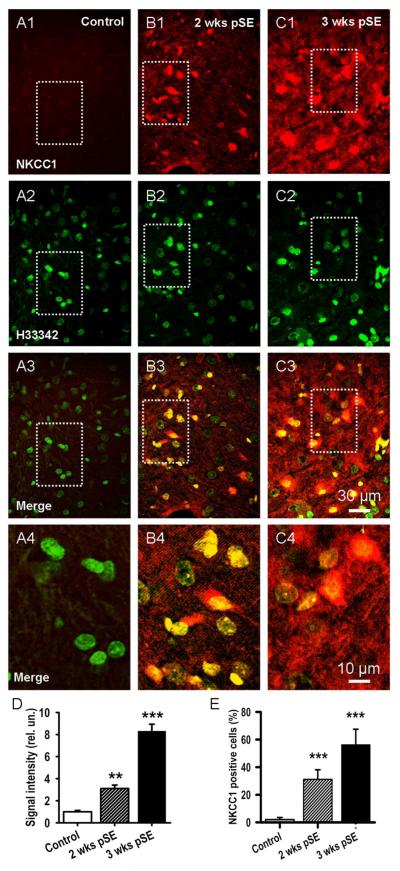
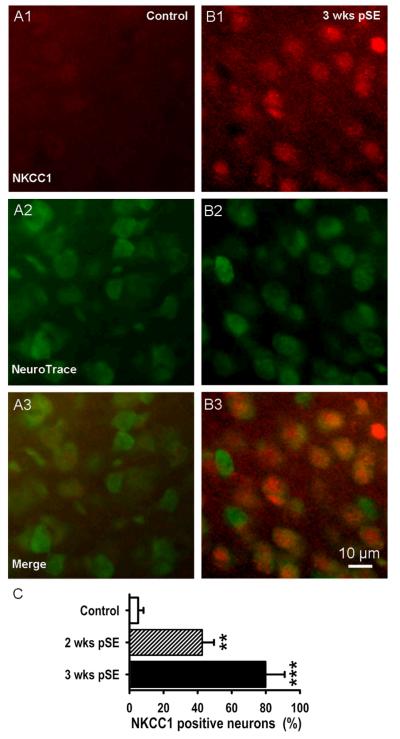
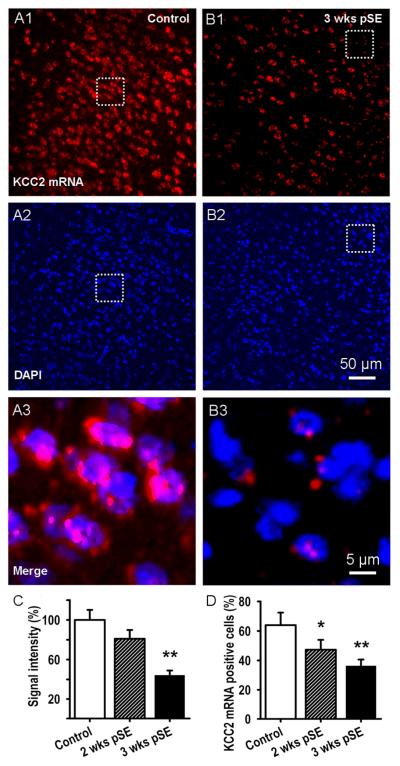
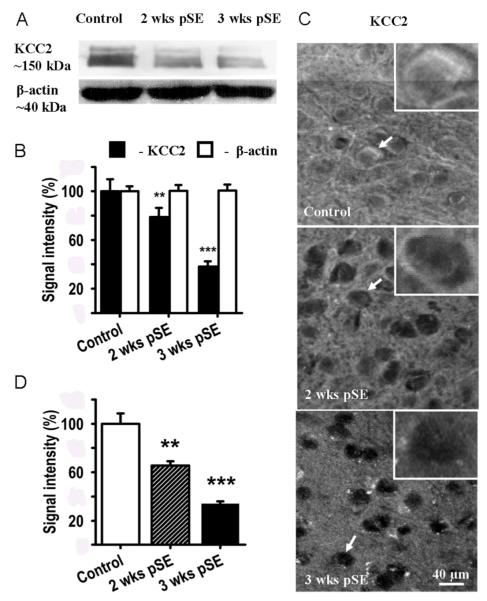
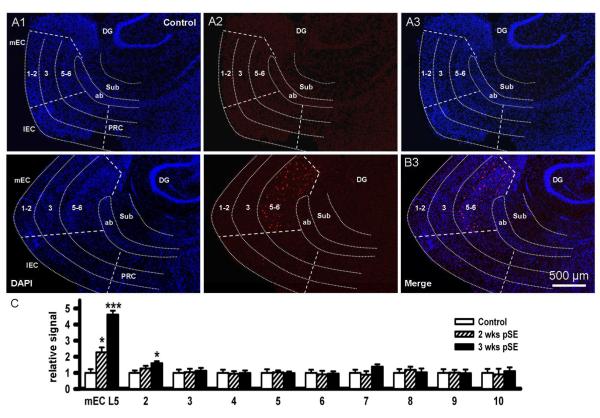
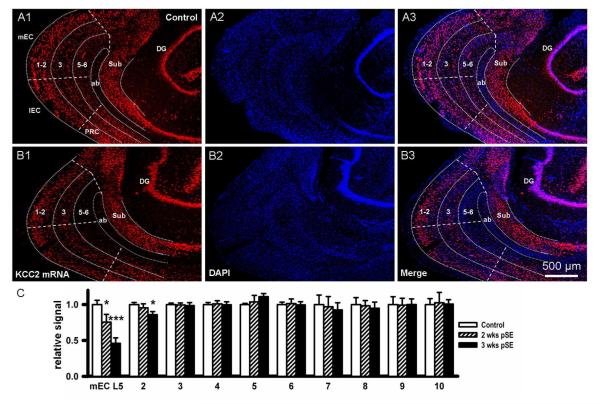
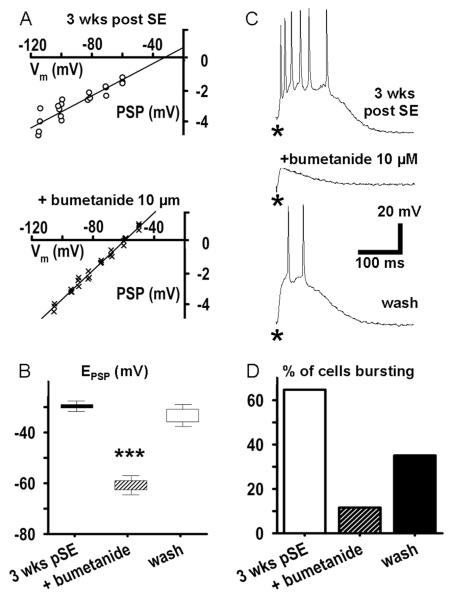
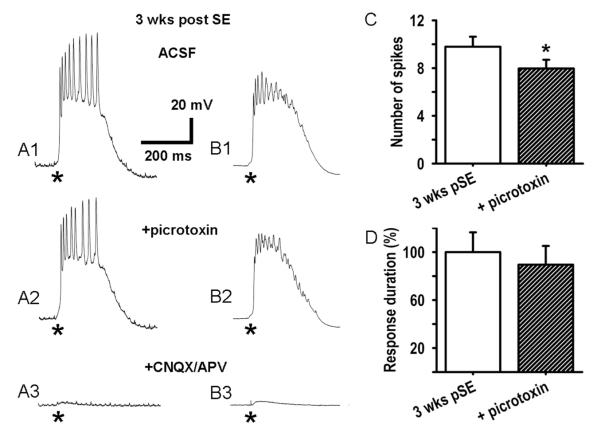
Epileptiform neuronal activity during seizures is observed in many brain areas, but its origins following status epilepticus (SE) are unclear. We have used the Li low-dose pilocarpine rat model of temporal lobe epilepsy to examine early development of epileptiform activity in the deep entorhinal cortex (EC). We show that during the 3-week latent period that follows SE, an increasing percentage of neurons in EC layer 5 respond to a single synaptic stimulus with polysynaptic burst depolarizations. This change is paralleled by a progressive depolarizing shift of the inhibitory postsynaptic potential reversal potential in layer 5 neurons, apparently caused by upregulation of the Cl(-) inward transporter NKCC1 and concurrent downregulation of the Cl(-) outward transporter KCC2, both changes favoring intracellular Cl(-) accumulation. Inhibiting Cl(-) uptake in the latent period restored more negative GABAergic reversal potentials and eliminated polysynaptic bursts. The changes in the Cl(-) transporters were highly specific to the deep EC. They did not occur in layers 1-3, perirhinal cortex, subiculum or dentate gyrus during this period. We propose that the changes in Cl(-) homeostasis facilitate hyperexcitability in the deep entorhinal cortex leading to epileptiform discharge there, which subsequently affects downstream cortical regions.


Figures

Figure 1
Figure 1. Increased polysynaptic burst excitation in EC L5 neurons post SE
A: Postsynaptic response in EC-L5 neuron from untreated rat to single presynaptic stimulus (*, 500 nA, 70 μs ). B: Polysynaptic burst response in L5 neuron 3 weeks after SE to a much smaller stimulus (*, 100 nA, 70 μs, see also Figs. 10 & 11). The primary evoked PSP (box) is shown enlarged in the inset (30ms × 5mV). For this recording the cell was hyperpolarized by negative DC to prevent firing. C: Bar chart showing percent of EC-L5 neurons responding to a single stimulation with a polysynaptic depolarization. A single stimulus evokes a polysynaptic response in only 2.4% of EC-L5 cells from control rats (n=42), but in 10.8% and in 61.8% of cells from rats 2 (n=37) and 3 weeks after SE (n=34), respectively.
Figure 2
Figure 2. Positive shift of the GABAAergic PSP reversal potential 2 and 3 weeks after SE
A: Monosynaptic GABAAergic PSPs evoked at 5 different membrane potentials in EC L5 neuron from a control (upper traces) and from a rat 3 weeks after SE (lower traces) recorded with a sharp microelectrode. Membrane potential was altered by current application (500 ms pulses) through the microelectrode. Asterisks denote time of presynaptic stimulus. Recordings were performed in the presence of the AMPA/kainate glutamate receptor antagonist CNQX (10 μM) and the NMDA receptor antagonist APV (50 μM). B1,2,3: I-V relationship of prestimulus membrane potential (o) and the absolute value of the GABAAergic PSP (×) measured 15 ms after stimulation vs. electrode current. Data were obtained using the protocol of part A, fitted with linear regressions. Intersection of membrane potential and PSP plots occurs at the PSP reversal potential (EPSP, arrows). C: Histograms showing the number of EC L5 neurons displaying a GABAAergic reversal potential within a 2 mV range at the 3 time points examined. Envelops (dotted curves) are best Gaussian fits to the 5 obvious populations. In neurons from control rats, the EPSP Gaussian fit has a median value of ~ −69 mV. Neurons from rats both 2 and 3 weeks after SE broke into 2 classes, no EPSP shift, and significant shift. At 2 weeks 77% of the neurons had a shifted mean of ~ −54 and at 3 weeks 81% displayed a mean shift to ~ −28 mV. The non-shifting neurons comprised 23 and 19% of the populations respectively. Their EPSP distribution was indistinguishable from the control group. N=24, 34 and 26 recorded cells for control and 2 and 3 week groups. D: Mean±SEM of GABAAergic EPSP relative to resting membrane potential (RMP) for the shifted populations 2 (n=26) and 3 weeks after SE (n=21) demonstrate a progressive depolarizing shift of the reversal potential in comparison with control (n=24, ** p<0.01, *** p<0.001).
Figure 3
Figure 3. mRNA for NKCC1, a Cl- inward transporter, progressively increases post SE in EC L5
A, B: Fluorescence in-situ-hybridization shows up-regulation of NKCC1 mRNA 3 weeks after pilocarpine insult in comparison with control (red signal, A1, B1). DAPI nuclear stain indicated no change in cell numbers (blue signal A2, B2). The lower panels, A3 & B3 show magnified, merged views of the areas outlined in A1,2 & B1,2 and illustrate perinuclear localization of NKCC1 mRNA (A3, B3). C: Bar graph showing increase in NKCC1 mRNA post SE. Data were quantified by forming the ratio of the total NKCC1 signal to total fluorescence of the nuclear stain in a given ROI. These ratios were then normalized to the values from control rat (mean±SEM, n~100 ROIs for 4 rats in each group, * p<0.01, *** p<0.001). D: Mean number of NKCC1 mRNA-positive cells, expressed as % of nuclei number determined from DAPI staining (Mean±SEM, n~300 cells for 4 rats in each group, * p<0.05, ** p<0.01).
Figure 4
Figure 4. NKCC1 protein is also upregulated
A, B, C: Fluorescence immunohistochemistry demonstrates progressive increase in expression of NKCC1 protein from 2 to 3 weeks after SE in EC L5 (red signal, A1, B1, C1). Hoechst 33342 nuclei counterstain shows stable cell number (A2, B2 and C2, green signal). Merged views of the upper panel sets (A3, B3, C3) illustrate the pervasive increase in expression. The boxed regions of these panels are shown enlarged below to better illustrate perinuclear and somatic location of NKCC1 (A4, B4, C4). D: Bar graph showing increase in NKCC1 protein post SE. Data were quantified by forming the ratio of the total NKCC1 signal to total fluorescence of the nuclear stain in a given ROI. These ratios were then normalized to the values from control rat (mean±SEM, 3 rats, ** p<0.01, *** p<0,001). E: Mean number of NKCC1 positive cells, expressed as % of nuclei number (H33342, mean±SEM, 3 rats, *** p<0.01).
Figure 5
Figure 5. EC L5 neurons increase expression of NKCC1 protein post SE
A, B: Fluorescence immunohistochemistry demonstrates strong expression of NKCC1 protein 3 weeks after SE in EC L5 (red signal, A1, B1). Neuron-specific NeuroTrace counterstain shows stable cell number (A2, B2, green signal). Overlay views illustrate perinuclear and somatic location of NKCC1 (A3, B3). Here, neurons throughout a 60 μm thick tissue block are shown. C: Mean of NKCC1 positive neurons, in % of NeuroTrace positive cells, progressively increases 2 and 3 weeks after pilocarpine-evoked SE in EC L5 (mean±SEM, 3 rats, *** p<0.01).
Figure 6
Figure 6. mRNA for KCC2, a neuronal Cl- outward transporter, progressively decreases post SE in EC L5
A, B: KCC2 mRNA expression detected by fluorescence in-situ-hybridization shows down-regulation of KCC2 mRNA 3 weeks after pilocarpine induced SE in comparison with control (A1, B1, red signal). DAPI nuclear stain indicated no change in cell numbers (A2 & B2: blue signal). Merged magnified views of the areas outlined in A1,2 & B1,2 illustrate perinuclear localization of KCC2 mRNA (A3 & B3). C: Bar graph showing decrease in KCC2 mRNA post SE. Data were quantified by forming the ratio of the total KCC2 signal to total fluorescence of the nuclear stain in a given ROI. These ratios were then normalized to the values from control rat (mean±SEM, n~100 ROIs for 4 rats in each group, ** p<0.01). D: Mean number of KCC2 positive cells, expressed as % of nuclei number (DAPI, mean±SEM, n~300 cells for 4 rats in each group, * p<0.05 and ** p<0.01, respectively).
Figure 7
Figure 7. KCC2 protein also decreases post SE
A: Western blot KCC2 bands (~150 kDa) show significant gradual down-regulation of KCC2 in an EC L5 region of rats 2 (2 wks pSE) and 3 weeks (3 wks pSE) after pilocarpine induced SE in comparison with control. β-actin (~ 40 kDa) served as a loading control. B: Average optical densities, extracted from blots as in A, in % of control (mean±SEM, n=5, ** p<0.01, *** p<0.001). These data are in excellent agreement with the mRNA and IPSP reversal potential data. C: Immunohistochemistry shows a gradual decrease of KCC2 protein 2 and 3 weeks after pilocarpine induced SE, most prominent in somata. The white outlined boxes in each panel show a magnified view of the cells identified by white arrows in each panel. D: Bar graph showing decrease in average immunohistochemistry KCC2 signals post SE, normalized to control.(mean±SEM, n~100 ROIs for 4 rats in each group, ** p<0.01, *** p<0.001).
Figure 8
Figure 8. mRNA for NKCC1 does not increase in other cortical regions
A, B: Fluorescence in-situ-hybridization studies for NKCC1 mRNA showing the brain region encompassing medial (mEC) and lateral EC (lEC), angular bundle (ab), subiculum (Sub), dentate gyrus (DG), and perirhinal cortex (PRC): A, control slice; B, slice taken 3 weeks post SE. Left panels show DAPI staining of the region overlayed with rough outlines of the component areas (A1, B1). Middle panels show NKCC1 signal. In control, there is little to none while 3 weeks after SE signal is apparent in mid EC L5-6 but nowhere else (A2, B2). Images are merged in the right hand panels (A3, B3, for high power images see Fig. 3). C: Bar graph showing increase in NKCC1 mRNA only in deep EC post SE (mEC L5, t54=2.15, P=0.037 and t54=3.54, P=0.0009, respectively) and lateral EC L5 labed # 2 (t54=1.02, P=0.12 and t54=1.28, P=0.047, respectively), but no significant changes occurred in mEC L3 (# 3, t54=0.93, P=0.24 and t49=0.42, P=0.34, respectively), lEC (# 4, t54=0.27, P=0.86 and t54=0.24, P=0.094, respectively), mEC L1-2 (# 5, t54=−1.25, P=0.32 and t54=0.34, P=0.23, respectively), lEC L1-2 (# 6, t54=1.24, P=0.078 and t54=0.52, P=0.27, respectively), subiculum (# 7, t54=1.54, P=0.49 and t54=1.67, P=0.063, respectively), dentate gyrus (# 8, t54=0.45, P=0.098 and t54=−1.35, P=0.26, respectively), deep perirhinal cortex (# 9, t54=0.53, P=0.47 and t54=2.01, P=0.48, respectively) and PRC L1-3 (# 10 t54=−1.36, P=0.81 and t54=0.28, P=0.81, respectively; data extracted from higher magnificiation images).
Figure 9
Figure 9. mRNA for KCC2 decreases only in deep EC
A, B: Fluorescence in-situ-hybridization studies for KCC2 mRNA showing the brain region encompassing medial (mEC) and lateral EC (lEC), angular bundle (ab), subiculum (Sub), dentate gyrus (DG), and perirhinal cortex (PRC): A, control slice; B, slice taken 3 weeks post SE. Left panels show KCC2 staining of the region, overlayed with rough outlines of the component areas (A1, A2). In control, there is ubiquitous expression while 3 weeks after SE signal has disappeared in EC L5-6, but nowhere else. Middle panels show DAPI staining of the region (A2, B2). Images are merged in the right hand panels (A3, B3, for high power images see Fig. 6). C: Bar graph showing decrease in KCC2 mRNA only in deep EC post SE (mEC L5, t62=1.95, P=0.082 and t62=2.34, P=0.0095, respectively), and lateral EC L5 labed # 2 (t62=1.86, P=0.093 and t62=2.41, P=0.039, respectively), but no significant changes occurred in mEC L3 (# 3, t62=0.34, P=0.32 and t62=−1.22, P=0.51, respectively), lEC (# 4, t62=−0.25, P=0.17 and t62=0.24, P=0.36, respectively), mEC L1-2 (# 5, t62=1.06, P=0.85 and t62=0.43, P=0.62, respectively), lEC L1-2 (# 6, t62=−0.45, P=0.68 and t62=0.15, P=0.39, respectively), subiculum (# 7, t62=−1.01, P=0.098 and t62=1.84, P=0.065, respectively), dentate gyrus (# 8, t62=1.05, P=0.77 and t62=−2.03, P=0.49, respectively), deep perirhinal cortex (# 9, t62=1.33, P=0.28 and t62=−1.52, P=0.53, respectively) and PRC L1-3 (# 10, t62=1.12, P=0.085 and t62=0.36, P=0.14, respectively; data extracted from higher magnificiation images).
Figure 10
Figure 10. The NKCC1 inhibitor bumetanide partially restores E(PSP), and suppresses polysynaptic excitation
A: Plots of PSP amplitude against membrane potential before (top, open circles) and after a 20 min exposure to bumetanide (bottom, crosses) of an EC L5 neuron from a rat 3 weeks after SE demonstrate a hyperpolarizing shift of PSP reversal potential. Data were obtained from protocols shown in Fig. 2A. The E(PSP) shifts from −29.7 mV to −60.9 mV. Measurements were made during block of EPSPs by CNQX (10 μM) and APV (50 μM). B: Population data showing that the positive-shifted GABAA-PSP reversal potential is strongly and reversibly repolarized by bumetanide (mean±SEM, n=3, *** p<0.001). C: Top record shows that the polysynaptic response to a single stimulus (100 nA) observed 3 weeks post SE is blocked by bumetanide (middle trace) but shows recovery with 30 minutes washout of the drug (bottom trace). D: Population data showing that bumetanide decreases the % of EC-L5 neurons 3 weeks post SE exhibiting a polysynaptic depolarization in response to a single stimulation from 64.8% to 11.6% (n=14). This number recovered to 35.1% after a 30 min washout of bumetanide for 30 minutes.
Figure 11
Figure 11. Picrotoxin has a minor effect on polysynaptic bursting
A: Block of GABAA receptors by picrotoxin (100 μM) decreased action potential firing during the polysynaptic burst response by a small but significant amount (A1, A2; stimulus 100 nA, 70 μs delivered at *). Subsequent additional block of ionotropic glutamate receptors by CNQX (10 μM) and APV (50 μM) nearly eliminated all postsynaptic responses (A3). B: Averages of 10 bursts from the same cell reveal a shorter burst duration in picrotoxin. Decreased spike amplitudes in these averages indicate reduced precision in the firing pattern during the burst in picrotoxin. C: Population data showing that picrotoxin reduces the mean number of spikes in polysynaptic burst responses from 9.8±0.8 to 7.9±0.7 spikes per response (mean±SEM, n=8 cells, 5 rats, *p<0.05). D: In picrotoxin there is a trend towards a 10.5% decrease of the duration of polysynaptic bursts (mean±SEM, n=8, p=0.094).

References

    1. Andre V, Dube C, Francois J, Leroy C, Rigoulot MA, Roch C, Namer IJ, Nehlig A. Pathogenesis and pharmacology of epilepsy in the lithium-pilocarpine model. Epilepsia. 2007;48(Suppl 5):41–47. - PubMed
    1. Annegers JF, Grabow JD, Groover RV, Laws ER, Jr., Elveback LR, Kurland LT. Seizures after head trauma: a population study. Neurology. 1980;30:683–689. - PubMed
    1. Bartolomei F, Khalil M, Wendling F, Sontheimer A, Regis J, Ranjeva JP, Guye M, Chauvel P. Entorhinal cortex involvement in human mesial temporal lobe epilepsy: an electrophysiologic and volumetric study. Epilepsia. 2005;46:677–687. - PubMed
    1. Bartolomei F, Wendling F, Regis J, Gavaret M, Guye M, Chauvel P. Pre-ictal synchronicity in limbic networks of mesial temporal lobe epilepsy. Epilepsy Res. 2004;61:89–104. - PubMed
    1. Beck J, Lenart B, Kintner DB, Sun D. Na-K-Cl cotransporter contributes to glutamate-mediated excitotoxicity. J Neurosci. 2003;23:5061–5068. - PMC - PubMed

Publication types

MeSH terms