

Differential functional magnetic resonance imaging response to food pictures in successful weight-loss maintainers relative to normal-weight and obese controls
- PMID: 19675107
- PMCID: PMC2744621
- DOI: 10.3945/ajcn.2009.27924
Differential functional magnetic resonance imaging response to food pictures in successful weight-loss maintainers relative to normal-weight and obese controls
Abstract
Background: Prior research indicates that successful weight-loss maintainers (SWLs) work harder than people of normal weight to maintain their weight loss, including greater dietary restriction of fat and higher physical activity levels. However, little work to date has examined how SWLs differ biologically from normal-weight (NW) and obese controls.
Objective: The objective was to compare the brain responses of SWLs to food pictures with those of NW and obese controls.
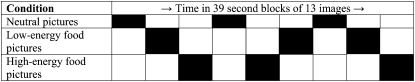
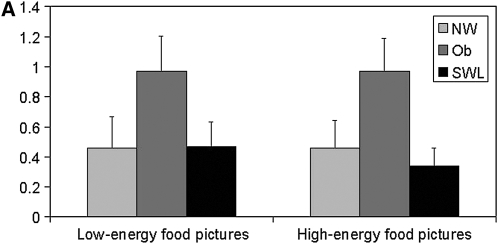
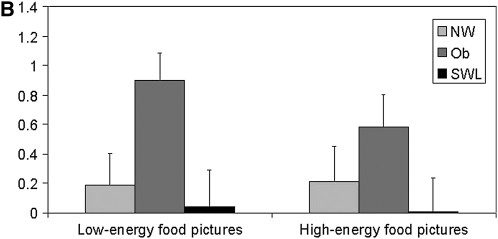
Design: Blood oxygen level-dependent responses to high- and low-energy food pictures were measured in 18 NW controls, 16 obese controls, and 17 SWLs.
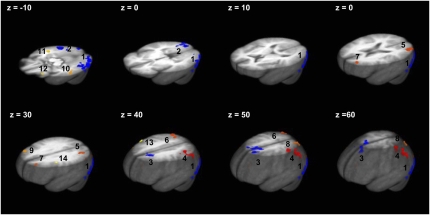
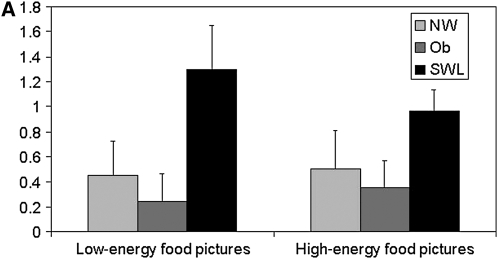
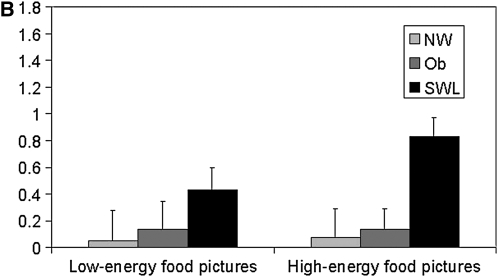
Results: Group differences were identified in 4 regions, which indicated significant change in activation in response to the food pictures. SWLs showed greater activation in the left superior frontal region and right middle temporal region than did NW and obese controls-a pattern of results confirmed in exploratory voxel-wise analyses. Obese controls also showed greater activation in a bilateral precentral region.
Conclusions: These results suggest that SWLs show greater activation in frontal regions and primary and secondary visual cortices-a pattern consistent with greater inhibitory control in response to food cues and greater visual attention to the food cues. A greater engagement of inhibitory control regions in response to food cues as well as a greater monitoring of foods may promote control of food intake and successful weight-loss maintenance.
Figures
Comment in
-
In search of the basis of successful maintenance of weight loss.Am J Clin Nutr. 2009 Oct;90(4):908-9. doi: 10.3945/ajcn.2009.28518. Epub 2009 Aug 26. Am J Clin Nutr. 2009. PMID: 19710190 No abstract available.
Similar articles
-
Functional brain response to food images in successful adolescent weight losers compared with normal-weight and overweight controls.Obesity (Silver Spring). 2015 Mar;23(3):630-6. doi: 10.1002/oby.21004. Epub 2015 Feb 3. Obesity (Silver Spring). 2015. PMID: 25645425 Clinical Trial.
-
Brain response to food stimulation in obese, normal weight, and successful weight loss maintainers.Obesity (Silver Spring). 2012 Nov;20(11):2220-5. doi: 10.1038/oby.2012.125. Epub 2012 May 9. Obesity (Silver Spring). 2012. PMID: 22569002 Free PMC article.
-
fMRI reactivity to high-calorie food pictures predicts short- and long-term outcome in a weight-loss program.Neuroimage. 2012 Feb 1;59(3):2709-21. doi: 10.1016/j.neuroimage.2011.10.071. Neuroimage. 2012. PMID: 22332246 Free PMC article.
-
Salivary habituation to food stimuli in successful weight loss maintainers, obese and normal-weight adults.Int J Obes (Lond). 2010 Mar;34(3):593-6. doi: 10.1038/ijo.2009.267. Epub 2009 Dec 15. Int J Obes (Lond). 2010. PMID: 20010900 Free PMC article.
-
Inhibitory control as a potential treatment target for obesity.Nutr Neurosci. 2023 May;26(5):429-444. doi: 10.1080/1028415X.2022.2053406. Epub 2022 Mar 28. Nutr Neurosci. 2023. PMID: 35343884 Review.
Cited by
-
Got chocolate? Bilateral prefrontal cortex stimulation augments chocolate consumption.Appetite. 2018 Dec 1;131:28-35. doi: 10.1016/j.appet.2018.08.032. Epub 2018 Aug 29. Appetite. 2018. PMID: 30171915 Free PMC article. Clinical Trial.
-
A comparison of functional brain changes associated with surgical versus behavioral weight loss.Obesity (Silver Spring). 2014 Feb;22(2):337-43. doi: 10.1002/oby.20630. Epub 2013 Oct 17. Obesity (Silver Spring). 2014. PMID: 24115765 Free PMC article. Clinical Trial.
-
Food Cues and Obesity: Overpowering Hormones and Energy Balance Regulation.Curr Obes Rep. 2018 Jun;7(2):122-129. doi: 10.1007/s13679-018-0303-1. Curr Obes Rep. 2018. PMID: 29619632 Free PMC article. Review.
-
Changes in Reward after Gastric Bypass: the Advantages and Disadvantages.Curr Atheroscler Rep. 2015 Oct;17(10):61. doi: 10.1007/s11883-015-0534-5. Curr Atheroscler Rep. 2015. PMID: 26358733 Review.
-
Relation of dietary restraint scores to activation of reward-related brain regions in response to food intake, anticipated intake, and food pictures.Neuroimage. 2011 Mar 1;55(1):233-9. doi: 10.1016/j.neuroimage.2010.12.009. Epub 2010 Dec 13. Neuroimage. 2011. PMID: 21147234 Free PMC article.
References
-
- Wing RR. Behavioral approaches to the treatment of obesity. Bray GA, Bouchard C, James WPT, eds. Handbook of obesity New York, NY: Marcel Dekker Inc, 1998:855–73
-
- Wadden TA, Sternberg JA, Letizia KA, Stunkard AJ, Foster GD. Treatment of obesity by very low calorie diet, behavior therapy, and their combination: a five-year perspective. Int J Obes 1989;13(suppl 2):39–46 - PubMed
-
- McGuire MT, Wing RR, Klem ML, Hill JO. Behavioral strategies of individuals who have maintained long-term weight losses. Obes Res 1999;7:334–41 - PubMed
-
- Rodin J, Schank D, Striegel-Moore R. Psychological features of obesity. Med Clin North Am 1989;73:47–66 - PubMed
-
- Craeynest M, Crombez G, Koster EH, Haerens L, De Bourdeaudhuij I. Cognitive-motivational determinants of fat food consumption in overweight and obese youngsters: the implicit association between fat food and arousal. J Behav Ther Exp Psychiatry 2008;39:354–68 - PubMed
Publication types
MeSH terms
Substances
Grants and funding
LinkOut - more resources
Full Text Sources
Other Literature Sources
Medical
