

Paradoxical coupling of triglyceride synthesis and fatty acid oxidation in skeletal muscle overexpressing DGAT1
- PMID: 19675136
- PMCID: PMC2768165
- DOI: 10.2337/db08-1096
Paradoxical coupling of triglyceride synthesis and fatty acid oxidation in skeletal muscle overexpressing DGAT1
Abstract
Objective: Transgenic expression of diacylglycerol acyltransferase-1 (DGAT1) in skeletal muscle leads to protection against fat-induced insulin resistance despite accumulation of intramuscular triglyceride, a phenomenon similar to what is known as the "athlete paradox." The primary objective of this study is to determine how DGAT1 affects muscle fatty acid oxidation in relation to whole-body energy metabolism and insulin sensitivity.
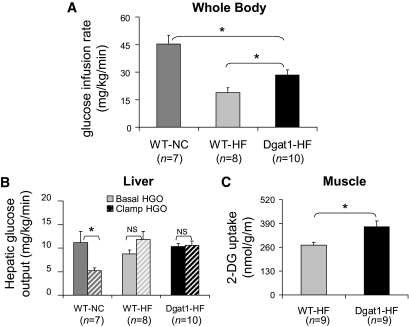
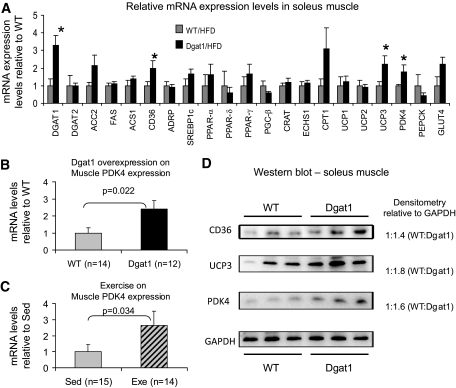
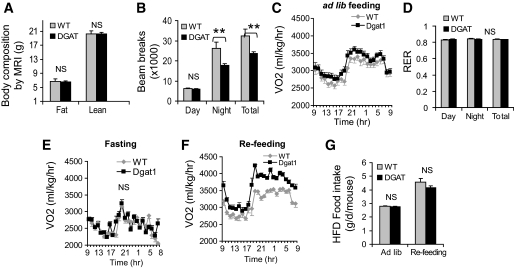
Research design and methods: We first quantified insulin sensitivity and the relative tissue contributions to the improved whole-body insulin sensitivity in muscle creatine kisase (MCK)-DGAT1 transgenic mice by hyperinsulinemic-euglycemic clamps. Metabolic consequences of DGAT1 overexpression in skeletal muscles were determined by quantifying triglyceride synthesis/storage (anabolic) and fatty acid oxidation (catabolic), in conjunction with gene expression levels of representative marker genes in fatty acid metabolism. Whole-body energy metabolism including food consumption, body weights, oxygen consumption, locomotor activity, and respiration exchange ratios were determined at steady states.
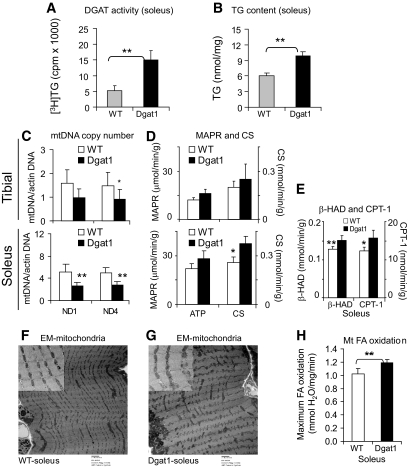
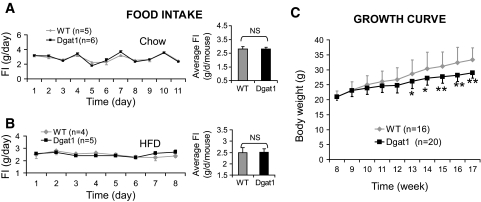
Results: MCK-DGAT1 mice were protected against muscle lipoptoxicity, although they remain susceptible to hepatic lipotoxicity. While augmenting triglyceride synthesis, DGAT1 overexpression also led to increased muscle mitochondrial fatty acid oxidation efficiency, as compared with wild-type muscles. On a high-fat diet, MCK-DGAT1 mice displayed higher basal metabolic rates and 5-10% lower body weights compared with wild-type littermates, whereas food consumption was not different.
Conclusions: DGAT1 overexpression in skeletal muscle led to parallel increases in triglyceride synthesis and fatty acid oxidation. Seemingly paradoxical, this phenomenon is characteristic of insulin-sensitive myofibers and suggests that DGAT1 plays an active role in metabolic "remodeling" of skeletal muscle coupled with insulin sensitization.
Figures
Similar articles
-
Upregulation of myocellular DGAT1 augments triglyceride synthesis in skeletal muscle and protects against fat-induced insulin resistance.J Clin Invest. 2007 Jun;117(6):1679-89. doi: 10.1172/JCI30565. Epub 2007 May 17. J Clin Invest. 2007. PMID: 17510710 Free PMC article.
-
Constitutive UCP3 overexpression at physiological levels increases mouse skeletal muscle capacity for fatty acid transport and oxidation.FASEB J. 2005 Jun;19(8):977-9. doi: 10.1096/fj.04-2765fje. Epub 2005 Apr 6. FASEB J. 2005. PMID: 15814607
-
Upregulation of triglyceride synthesis in skeletal muscle overexpressing DGAT1.Lipids Health Dis. 2013 May 4;12:63. doi: 10.1186/1476-511X-12-63. Lipids Health Dis. 2013. PMID: 23642106 Free PMC article.
-
Stearoyl-CoA desaturase--a new player in skeletal muscle metabolism regulation.J Physiol Pharmacol. 2006 Nov;57 Suppl 10:31-42. J Physiol Pharmacol. 2006. PMID: 17242489 Review.
-
Role of skeletal muscle lipids in the pathogenesis of insulin resistance of obesity and type 2 diabetes.J Diabetes Investig. 2021 Nov;12(11):1934-1941. doi: 10.1111/jdi.13614. Epub 2021 Jul 17. J Diabetes Investig. 2021. PMID: 34132491 Free PMC article. Review.
Cited by
-
BDA-410 Treatment Reduces Body Weight and Fat Content by Enhancing Lipolysis in Sedentary Senescent Mice.J Gerontol A Biol Sci Med Sci. 2017 Aug 1;72(8):1045-1053. doi: 10.1093/gerona/glw192. J Gerontol A Biol Sci Med Sci. 2017. PMID: 27789616 Free PMC article.
-
Endothelial cell CD36 optimizes tissue fatty acid uptake.J Clin Invest. 2018 Oct 1;128(10):4329-4342. doi: 10.1172/JCI99315. Epub 2018 Jul 26. J Clin Invest. 2018. PMID: 30047927 Free PMC article.
-
The role of lipid droplets in metabolic disease in rodents and humans.J Clin Invest. 2011 Jun;121(6):2102-10. doi: 10.1172/JCI46069. Epub 2011 Jun 1. J Clin Invest. 2011. PMID: 21633178 Free PMC article. Review.
-
Re-patterning of skeletal muscle energy metabolism by fat storage-inducing transmembrane protein 2.J Biol Chem. 2011 Dec 9;286(49):42188-42199. doi: 10.1074/jbc.M111.297127. Epub 2011 Oct 14. J Biol Chem. 2011. PMID: 22002063 Free PMC article.
-
Origins of metabolic complications in obesity: adipose tissue and free fatty acid trafficking.Curr Opin Clin Nutr Metab Care. 2011 Nov;14(6):535-41. doi: 10.1097/MCO.0b013e32834ad8b6. Curr Opin Clin Nutr Metab Care. 2011. PMID: 21849896 Free PMC article. Review.
References
-
- Goodpaster BH, He J, Watkins S, Kelley DE: Skeletal muscle lipid content and insulin resistance: evidence for a paradox in endurance-trained athletes. J Clin Endocrinol Metab 2001;86:5755–5761 - PubMed
-
- Russell AP: Lipotoxicity: the obese and endurance-trained paradox. Int J Obes Relat Metab Disord 2004;28:S66–S71 - PubMed
-
- Bassel-Duby R, Olson EN: Signaling pathways in skeletal muscle remodeling. Annu Rev Biochem 2006;75:19–37 - PubMed
-
- Simoneau JA, Colberg SR, Thaete FL, Kelley DE: Skeletal muscle glycolytic and oxidative enzyme capacities are determinants of insulin sensitivity and muscle composition in obese women. Faseb J 1995;9:273–278 - PubMed
Publication types
MeSH terms
Substances
Grants and funding
- K08 DK060530/DK/NIDDK NIH HHS/United States
- R01 HL045095/HL/NHLBI NIH HHS/United States
- U24 DK059635/DK/NIDDK NIH HHS/United States
- R03 DK071866/DK/NIDDK NIH HHS/United States
- DK-063034/DK/NIDDK NIH HHS/United States
- HL45095/HL/NHLBI NIH HHS/United States
- R01 HL073029/HL/NHLBI NIH HHS/United States
- R01 DK063034/DK/NIDDK NIH HHS/United States
- DK-026687/DK/NIDDK NIH HHS/United States
- DK-60530/DK/NIDDK NIH HHS/United States
- HL-73029/HL/NHLBI NIH HHS/United States
- R01 DK040936/DK/NIDDK NIH HHS/United States
- P30 DK020541/DK/NIDDK NIH HHS/United States
- R37 HL045095/HL/NHLBI NIH HHS/United States
- P30 DK026687/DK/NIDDK NIH HHS/United States
- P60 DK020541/DK/NIDDK NIH HHS/United States
- DK-071866/DK/NIDDK NIH HHS/United States
- DK-020541/DK/NIDDK NIH HHS/United States
LinkOut - more resources
Full Text Sources
Molecular Biology Databases
