. 2009 Nov;58(11):2498-505.
doi: 10.2337/db09-0216. Epub 2009 Aug 12.

Adipose tissue exosome-like vesicles mediate activation of macrophage-induced insulin resistance

Affiliations

Adipose tissue exosome-like vesicles mediate activation of macrophage-induced insulin resistance

Zhong-bin Deng et al. Diabetes. 2009 Nov.

Abstract

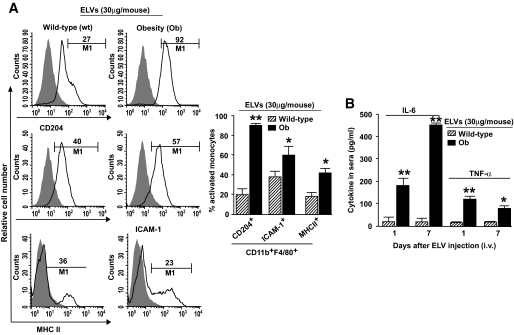
Objective: We sought to determine whether exosome-like vesicles (ELVs) released from adipose tissue play a role in activation of macrophages and subsequent development of insulin resistance in a mouse model.

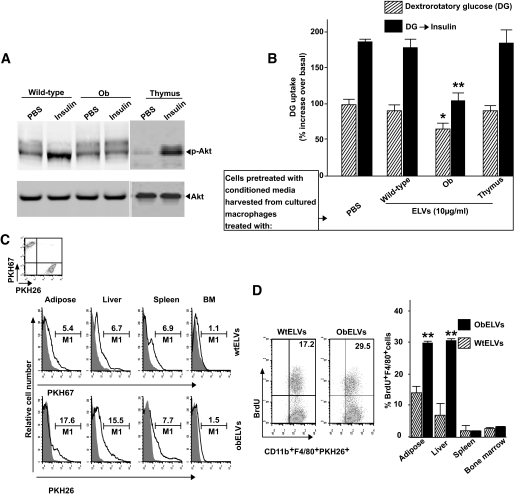
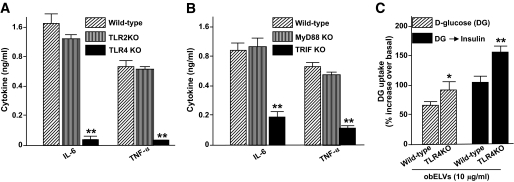
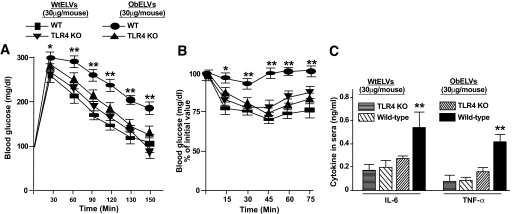
Research design and methods: ELVs released from adipose tissue were purified by sucrose gradient centrifugation and labeled with green fluorescent dye and then intravenously injected into B6 ob/ob mice (obese model) or B6 mice fed a high-fat diet. The effects of injected ELVs on the activation of macrophages were determined through analysis of activation markers by fluorescence-activated cell sorter and induction of inflammatory cytokines using an ELISA. Glucose tolerance and insulin tolerance were also evaluated. Similarly, B6 mice with different gene knockouts including TLR2, TLR4, MyD88, and Toll-interleukin-1 receptor (TIR) domain-containing adaptor protein inducing interferon-beta (TRIF) were also used for testing their responses to the injected ELVs.

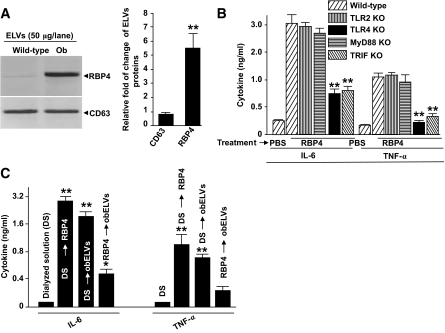
Results: ELVs are taken up by peripheral blood monocytes, which then differentiate into activated macrophages with increased secretion of tumor necrosis factor-alpha (TNF-alpha) and interleukin-6 (IL-6). Injection of obELVs into wild-type C57BL/6 mice results in the development of insulin resistance. When the obELVs were intravenously injected into TLR4 knockout B6 mice, the levels of glucose intolerance and insulin resistance were much lower. RBP4 is enriched in the obELVs. Bone marrow-derived macrophages preincubated with recombinant RBP4 led to attenuation of obELV-mediated induction of IL-6 and TNF-alpha.

Conclusions: ELVs released by adipose tissue can act as a mode of communication between adipose tissues and macrophages. The obELV-mediated induction of TNF-alpha and IL-6 in macrophages and insulin resistance requires the TLR4/TRIF pathway.


Figures

FIG. 1.
FIG. 1.
Adipose obELVs activate macrophages. A: Wild-type B6 mice fed an HFD for 3 months starting at 2 months of age were injected intravenously with the PKH67+-labeled obELVs or wtELVs (30 μg/mouse). Twenty-four hours after the injection, CD11b+F4/80+PKH67+ cells from peripheral blood were analyzed for the presence of CD204, ICAM-1, and MHCII markers. Results were pooled from five independent experiments (n = 5 mice/experiment) and are presented as the means ± SE, *P < 0.05, **P < 0.01. B: Mice treated as described above at day 1 and 7, peripheral blood was collected at 4 h after the ELV injections, and the serum concentration of IL-6 and TNF-α were determined using a standard ELISA, *P < 0.05, **P < 0.01 (n = 5 mice per group). i.v., intravenous.
FIG. 2.
FIG. 2.
Adipose obELVs promote the differentiation and proliferation of BMDMs and impair activation of the insulin signaling pathway in vitro and macrophage infiltration into adipose tissues in vivo. C2C12 cells at 80% confluency were cultured for 24 h in the presence of conditioned medium harvested from 14-day cultures of bone marrow cells that had been pretreated with obELVs, wtELVs, or thymus exosomes (10 μg/ml) at day 0 of the culture and cultured in the presence or absence of GM-CSF. After a 3-h starvation, the C2C12 cells were stimulated with insulin (100 nmol/l) for 20 min and either lysed for Western blot analysis of phosphorylated Akt (A) or used for glucose uptake testing (B). Results presented are representative of a minimum of three experiments (A) or data are the means ± SE of three experiments with two replicates of each (B). *P < 0.05; **P < 0.01. C: B6 mice fed an HFD were intravenously injected with a mixture (1:1) of 4 × 10⁶ of BMDMsPKH26+ that had been preincubated with obELVs with BMDMsPKH67+ that had been preincubated with wtELVs. The percentage of injected macrophages infiltrating adipose tissue, liver, spleen, and bone marrow were determined by FACS analysis of PKH67 and PKH26 14 days after the injection. D: The PKH67+ or PKH26+ cells were gated and analyzed for CD11b+F4/80+. The proliferation of injected fluorescent dye–labeled CD11b+F4/80+ macrophages was then determined by FACS analysis of BrdU+ cells in the adipose tissue, liver, spleen, and bone marrow. A representative graph of FACS analysis of macrophage infiltration in adipose tissue is shown and the data represent the means ± SE from five mice from each group. **P < 0.01. BM, bone marrow.
FIG. 3.
FIG. 3.
The TLR4/TRIF pathway plays a role in adipose obELV-mediated macrophage activation and the impairment of the insulin response. A: BMDMs from wild-type B6, TLR2 knockout, or TLR4 knockout mice were treated with obELVs (10 μg/ml), and the quantity of IL-6 and TNF-α in 24 h culture supernatants was measured using a standard ELISA. B: BMDMs from wild-type B6, MyD88, or TRIF mice were treated with obELVs (10 μg/ml) at 0 h of the culture, and the quantity of IL-6 and TNF-α in the 24 h culture supernatants was determined as done in Fig. 3A, **P < 0.01. C: The C2C12 cells were cultured for 24 h in the presence of conditioned medium harvested at 24 h after addition of obELV (10 μg/ml) to BMDMs from TLR4 knockout B6 mice or wild-type B6 mice. Glucose uptake experiments were conducted as described in Fig. 2B, *P < 0.05, **P < 0.01. Data are the means ± SE of three experiments with two replicates (AC). KO, knockout.
FIG. 4.
FIG. 4.
ObELV RBP4 induces the production of macrophage proinflammatory cytokines via activation of the TLR4/TRIF pathway. A: Fifty micrograms of obELVs and wtELVs were lysed in protein lysis buffer, and each lysate was resolved by PAGE in a 10% SDS gel for Western blot analysis. The signal intensity of each protein was quantified using an Odyssey infrared imaging system (LI-COR). The ratios of signal intensity of each protein in obELVs:wtELVs were calculated and plotted (bar graphs). The data are presented as means of three independent experiments. B: BMDMs from wild-type B6 mice or B6 mice with different gene knockouts were treated with 5 μg/ml of the RBP4. The quantity of IL-6 and TNF-α produced was determined from the supernatants of 24-h cultures. The results represent the means ± SE of triplicate cultures. C: BMDMs from wild-type B6 mice were treated with a mouse RBP4 (5 μg/ml) or dialyzed solution as a control for 24 h. Cells were washed with PBS three times and cultured in the presence of obELVs (10 μg/ml) for an additional 24 h. The supernatants were harvested and IL-6 and TNF-α quantified by ELISA. Data represent the means ± SE of five replicate wells, *P < 0.05, **P < 0.01.
FIG. 5.
FIG. 5.
Injection of obELVs leads to the intolerance of glucose uptake, insulin resistance, and induction of inflammatory cytokines of mice. A and B: Wild-type B6 mice or TLR4 knockout of B6 mice (n = 10) were injected intravenously with obELVs or wtELVs (30 μg/mouse in 200 μl of PBS) every 3 days for 21 days. One day after the last injection (day 22), mice were fasted either overnight before receiving an intraperitoneal injection of 2 mg of dextrose/g body wt for glucose tolerance testing (A) or fasted for 4 h before receiving recombinant human insulin (1 unit/kg i.p.) for insulin responsiveness testing (B). Blood samples were taken at the indicated times (n = 10). Data are means ± SE, *P < 0.05, **P < 0.01. In addition, serum TNF-α and IL-6 was also quantified using a standard ELISA at 4 h after the last injection (C). Data are means ± SE, **P < 0.01. KO, knockout.

References

    1. Nakamachi T, Nomiyama T, Gizard F, et al. : PPARα agonists suppress osteopontin expression in macrophages and decrease plasma levels in patients with type 2 diabetes. Diabetes 2007;56:1662–1670 - PubMed
    1. Weisberg SP, Hunter D, Huber R, et al. : CCR2 modulates inflammatory and metabolic effects of high-fat feeding. J Clin Invest 2006;116:115–124 - PMC - PubMed
    1. Varma V, Yao-Borengasser A, Rasouli N, et al. : Human visfatin expression: relationship to insulin sensitivity, intramyocellular lipids, and inflammation. J Clin Endocrinol Metab 2007;92:666–672 - PMC - PubMed
    1. Liang CP, Han S, Okamoto H, et al. : Increased CD36 protein as a response to defective insulin signaling in macrophages. J Clin Invest 2004;113:764–773 - PMC - PubMed
    1. Morrison CD, Huypens P, Stewart LK, et al. : Implications of crosstalk between leptin and insulin signaling during the development of diet-induced obesity. Biochim Biophys Acta 2008;1792:409–416 - PMC - PubMed

Publication types

MeSH terms