. 2009 Oct;151(2):559-73.
doi: 10.1104/pp.109.143487. Epub 2009 Aug 12.

Multiple antibiotic resistance in Arabidopsis is conferred by mutations in a chloroplast-localized transport protein

Affiliations

Multiple antibiotic resistance in Arabidopsis is conferred by mutations in a chloroplast-localized transport protein

Sarah Conte et al. Plant Physiol. 2009 Oct.

Abstract

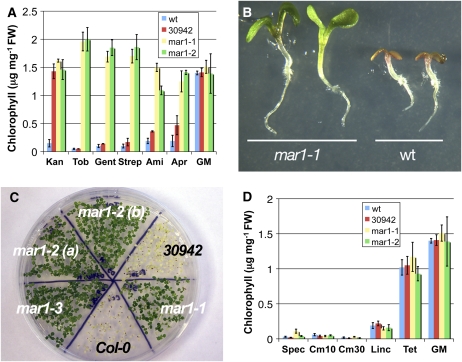
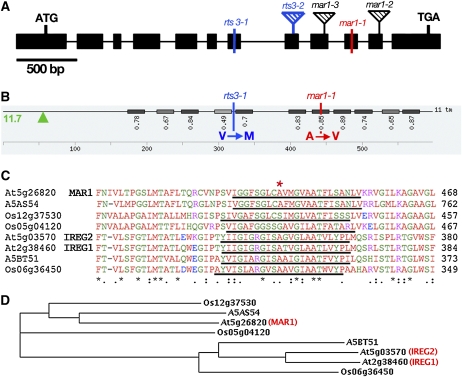
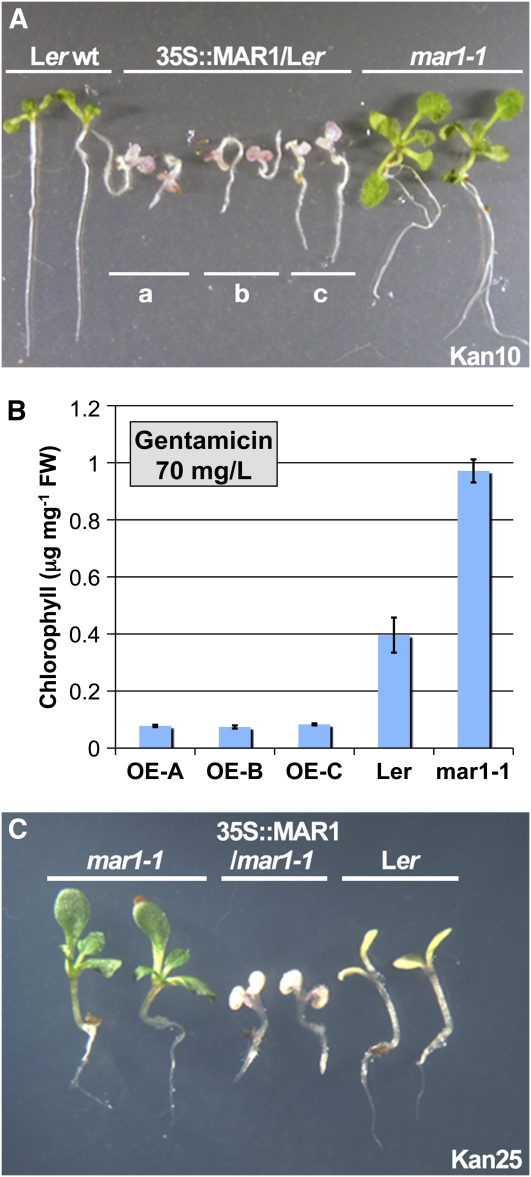
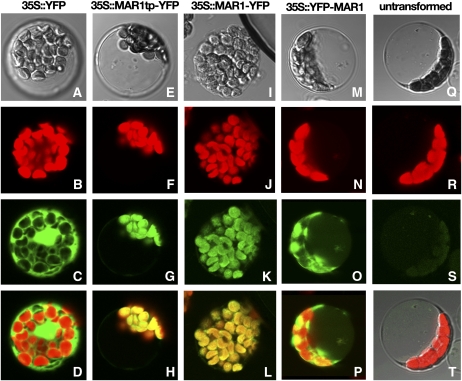
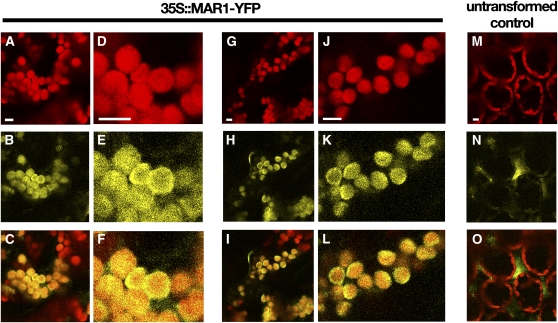
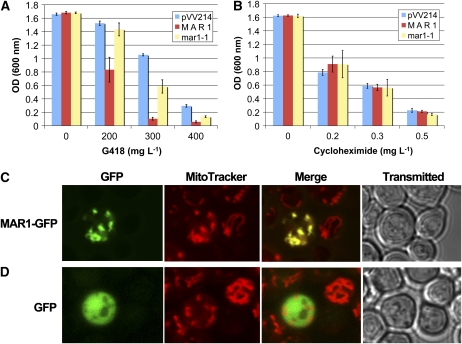
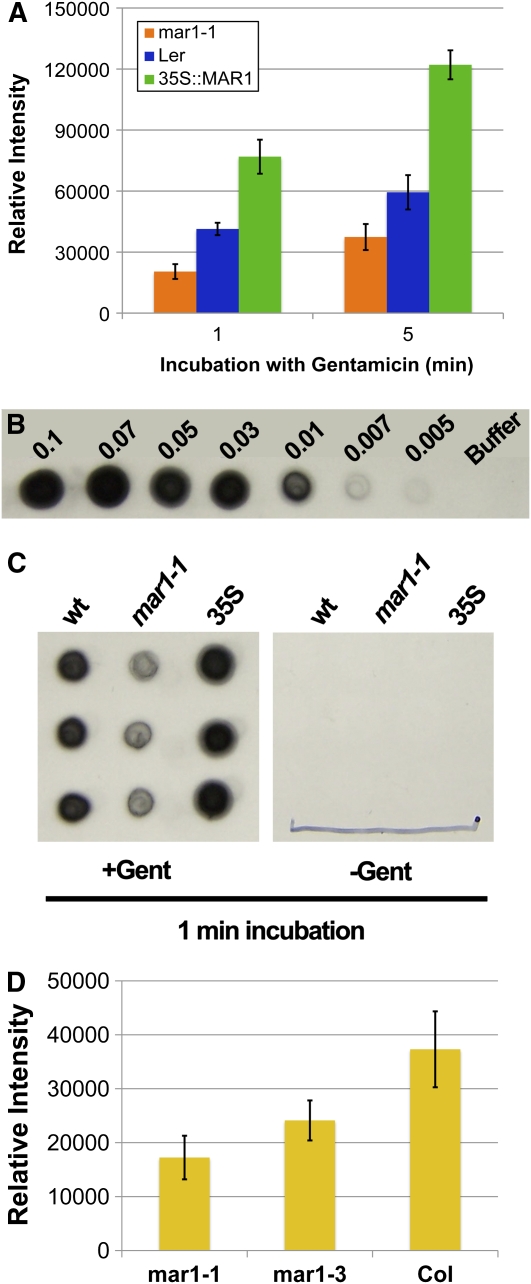
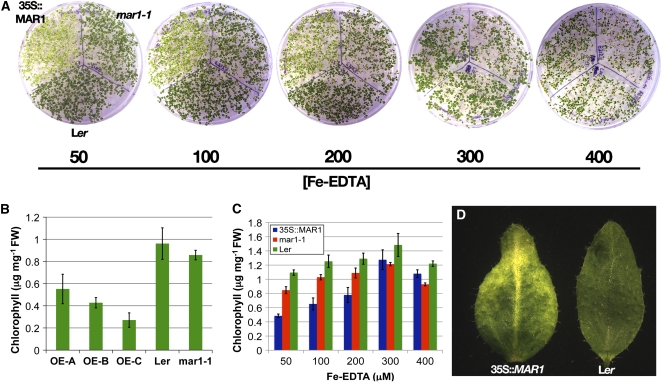
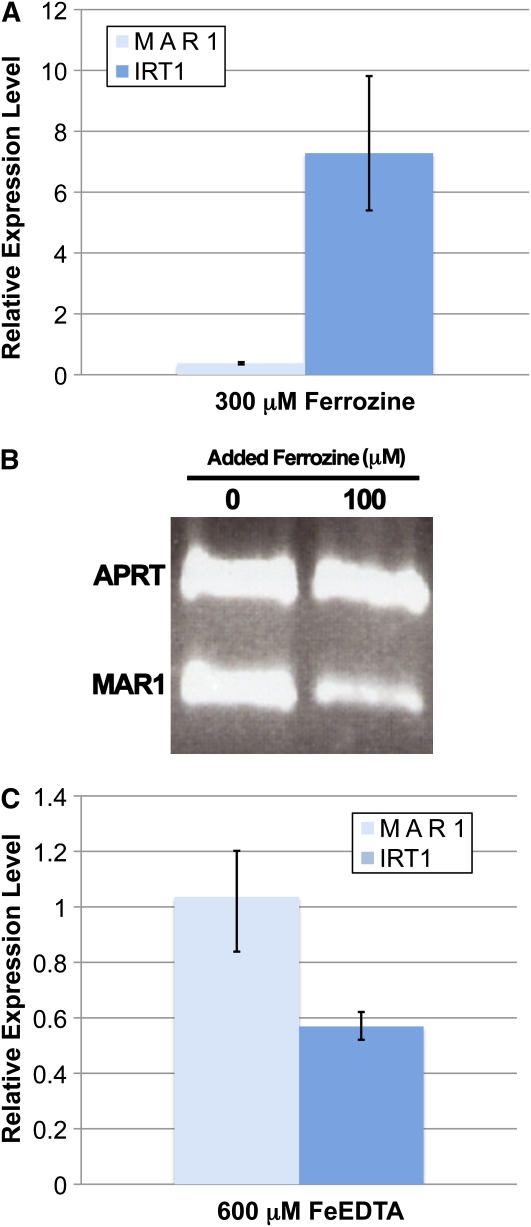
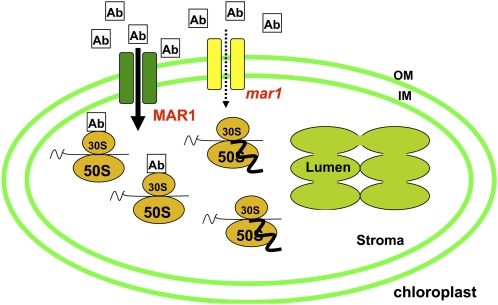
Widespread antibiotic resistance is a major public health concern, and plants represent an emerging antibiotic exposure route. Recent studies indicate that crop plants fertilized with antibiotic-laden animal manure accumulate antibiotics; however, the molecular mechanisms of antibiotic entry and subcellular partitioning within plant cells remain unknown. Here, we report that mutations in the Arabidopsis (Arabidopsis thaliana) locus Multiple Antibiotic Resistance1 (MAR1) confer resistance, while MAR1 overexpression causes hypersensitivity to multiple aminoglycoside antibiotics. Additionally, yeast expressing MAR1 are hypersensitive to the aminoglycoside G418. MAR1 encodes a protein with 11 putative transmembrane domains with low similarity to ferroportin1 from Danio rerio. A MAR1:yellow fluorescent protein fusion localizes to the chloroplast, and chloroplasts from plants overexpressing MAR1 accumulate more of the aminoglycoside gentamicin, while mar1-1 mutant chloroplasts accumulate less than the wild type. MAR1 overexpression lines are slightly chlorotic, and chlorosis is rescued by exogenous iron. MAR1 expression is also down-regulated by low iron. These data suggest that MAR1 is a plastid transporter that is likely to be involved in cellular iron homeostasis and allows opportunistic entry of multiple antibiotics into the chloroplast.


Figures

Figure 1.
Figure 1.
Resistance phenotypes of mar1-1, mar1-2, and mar1-3. A, Chlorophyll content of seedlings grown on aminoglycoside antibiotics. Wild-type (wt) seedlings and an unrelated homozygous T-DNA line, Salk_030942 (30942), were used as controls. Antibiotic concentrations were as follows: 25 mg/L kanamycin (Kan), 40 mg/L tobramycin (Tob), 70 mg/L gentamicin (Gent), 75 mg/L streptomycin (Strep), 100 mg/L amikacin (Ami), and 200 mg/L apramycin (Apr). GM was plain growth media (no antibiotic). B, Phenotypes of seedlings grown on MS media + kanamycin (25 mg/L) for 7 d. C, Phenotypes of the Salk T-DNA knockout mutants mar1-2 [two individual homozygotes are indicated as (a) and (b)] and mar1-3, along with control line (30942) and Col-0, grown on MS media + tobramycin (40 mg/L) for 14 d. D, Chlorophyll content of seedlings grown as in A on media containing four non-aminoglycoside antibiotics. Antibiotic concentrations were as follows: 8 mg/L spectinomycin (Spec), 10 and 30 mg/L chloramphenicol (Cm10 and Cm30, respectively), 25 mg/L lincomycin (Linc), and 10 mg/L tetracycline (Tet). GM was plain growth media (no antibiotic). FW, Fresh weight. [See online article for color version of this figure.]
Figure 2.
Figure 2.
Analysis of the MAR1 gene and protein. A, The MAR1 gene in Arabidopsis. Exons are depicted as solid black boxes. The mutation sites for mar1-1, rts3-1, as well as insertion sites for SALK lines mar1-2, mar1-3, and GABI-KAT line rts3-2 (Aufsatz et al., 2009) are shown. B, The MAR1 protein. Transmembrane domains in MAR1 are shown along with consensus score values (Schwacke et al., 2003). Domains with consensus scores above 0.42 are counted in the total number of transmembrane domains. A putative chloroplast transit peptide is predicted (with 11.7 consensus score value; Schwacke et al., 2003, 2007). The chloroplast transit peptide cleavage site (as predicted by ChloroP) is indicated with a green arrowhead. The amino acid changes in mutant mar1-1 and rts3-1 are also shown. C, Alignment of MAR1 (At5g26820) with its homologs in Arabidopsis (IREG2, At5g03570; IREG1, At2g38460), O. sativa (Os12g37530, Os05g04120, and Os06g36450), and V. vinifera (A5AS54 and A5BT51). Degree of conservation of various amino acids is indicated below the alignment by periods (highly conserved), colons (very highly conserved), and asterisks (completely conserved). Underlined areas illustrate the predicted transmembrane domains around the mutation site (as calculated by TMHMM, http://www.cbs.dtu.dk/services/TMHMM-2.0/). A red asterisk above the alignment indicates the site of the mar1-1 mutation. D, Phylogram of MAR1 and related proteins listed in C. The alignment in C and phylogenetic tree in D were created using ClustalW (Larkin et al., 2007). [See online article for color version of this figure.]
Figure 3.
Figure 3.
MAR1 overexpression results in hypersensitivity to antibiotics. A, Seeds were plated on kanamycin (10 mg/L; Kan10). After 14 d, two representative seedlings of each line were photographed. Phenotypes of three independent overexpression lines are shown (a, b, and c). All lines are in the Ler background. Ler wt, Ler wild type. B, Chlorophyll content (μg of chlorophyll per mg fresh weight [FW]) of MAR1 overexpression lines grown for 2 weeks on media containing gentamicin (70 mg/L). OE-A, OE-B, and OE-C are three independent MAR1 overexpression lines. Measurements represent the average chlorophyll content (±sd) of three separate batches of seedlings. C, Overexpression of MAR1 in mar1-1 background reverses the kanamycin resistance phenotype of mar1-1. Mutant mar1-1 plants were transformed with 35S∷MAR1, and seeds were plated on kanamycin (25 mg/L). After 14 d of growth, two representative seedlings were photographed. [See online article for color version of this figure.]
Figure 4.
Figure 4.
MAR1-YFP localizes to chloroplasts in protoplasts. Confocal microscopy images depict the localization of YFP alone under control of the 35S promoter or Cauliflower mosaic virus (35S∷YFP; first column), MAR1 chloroplast transit peptide fused to YFP (35S∷MAR1tp-YFP; second column), full-length MAR1 cDNA with YFP at the C terminus (35S∷MAR1-YFP; third column), full-length MAR1 cDNA with YFP at the N terminus (35S∷YFP-MAR1; fourth column), and an untransformed protoplast (fifth column). A bright-field image (A, E, I, M, and Q), chlorophyll autofluorescence (B, F, J, N, and R), YFP fluorescence (C, G, K, O, and S), and a merge of the two channels (D, H, L, and P) are included for each protoplast. We note that T is a merge of all three channels (transmitted, chlorophyll, and YFP).
Figure 5.
Figure 5.
MAR1-YFP localizes to chloroplasts in leaves of transformed plants. Plants were transformed with the C-terminal fusion construct 35S∷MAR1-YFP as described in “Materials and Methods.” Confocal single-slice images of the leaves of two individually transformed plants (A–F and G–L) were compared to an untransformed leaf (M–O). D to F and J to L are close-up images of A to C and G to I, respectively. Chlorophyll autofluorescence (A, D, G, J, and M), YFP fluorescence (B, E, H, K, and N), and a merge of the two channels (C, F, I, L, and O) are shown for each leaf section. Bars = 8 μm.
Figure 6.
Figure 6.
Expression of MAR1 in yeast confers hypersensitivity to G418. A and B, MAR1 and mar1-1 were expressed in yeast under control of the PGK promoter (vector pVV214). Cultures were standardized to optical density (OD) 0.01 at 600 nm before addition of antibiotic (A, G418 at 0, 200, 300, and 400 mg/L; B, cycloheximide at 0, 0.2, 0.3, and 0.5 mg/L). Cultures were analyzed spectrophotometrically after 48 h of growth, and optical densities were plotted. For both graphs, each bar represents the average absorbance of three independent cultures (±sd). C and D, Yeast strain BY4700 was transformed using MAR1 cDNA (lacking a stop codon) fused in frame with enhanced GFP (C) or using enhanced GFP alone (D). MitoTracker Red was used to visualize mitochondria, and a transmitted image is included to illustrate integrity of the cells.
Figure 7.
Figure 7.
MAR1 regulates gentamicin entry into chloroplasts. A, Plants were grown for 15 d before chloroplast isolation, and 8.5 × 10⁷ chloroplasts were incubated in 12.5 mg/mL gentamicin for each uptake reaction (1 and 5 min). B, Gentamicin standards (dissolved in chloroplast lysis buffer) were spotted as positive controls for every dot blot. Numbers above each dot indicate gentamicin concentration in mg/mL. C, Representative data from a 1-min uptake experiment. Left: Triplicate lysate spots from chloroplasts incubated with 12.5 mg/mL gentamicin for 1 min (+Gent). Right: Triplicate lysate spots from chloroplasts incubated in uptake buffer alone for 1 min (−Gent). In each panel, the left-hand column shows lysate from wild-type Ler chloroplasts (wt), the middle column shows lysate from mar1-1, and the right-hand column shows lysate from 35S∷MAR1 overexpressor chloroplasts (35S). D, Whole seedling uptake results. Seedlings were exposed to 70 mg/L gentamicin for 2 d, washed, and chloroplasts isolated. Chloroplasts (3 × 10⁸) from each line were lysed. For A and D, each bar represents the average relative intensity of three triplicate spots (±sd). [See online article for color version of this figure.]
Figure 8.
Figure 8.
Chlorosis of 35S∷MAR1 is rescued by 300 μm Fe-EDTA. A, Plants were grown for 2 weeks on varying concentrations of Fe-EDTA (as indicated) before photographing. For each plate, the top left section contains 35S∷MAR1 seedlings, the top right contains mar1-1 seedlings, and the bottom section contains Ler wild-type seedlings. B, Chlorophyll content of three MAR1 overexpression lines (OE-A, OE-B, and OE-C), Ler, and mar1-1 grown on MS plates supplemented with 1% Suc for 2 weeks (as described in “Materials and Methods”). C, Chlorophyll content of 35S∷MAR1, mar1-1, and Ler seedlings after 2 weeks growth on MS supplemented with varying concentrations of Fe-EDTA (as indicated). Chlorophyll was extracted and quantified as in B. FW, Fresh weight. D, Chlorosis phenotype of 35S∷MAR1 leaves from plants grown in soil for 32 d. [See online article for color version of this figure.]
Figure 9.
Figure 9.
MAR1 is down-regulated under iron deficiency. A, Plants were grown for 2 weeks in liquid MS supplemented with 1% Suc, and seedling tissue samples were taken before and after 4 d of incubation in 300 μm ferrozine. Expression levels of IRT1 and MAR1 are expressed as fold changes relative to their expression prior to ferrozine treatment. B, Plants were grown for 2 weeks on media containing 100 μm ferrozine prior to RNA extraction and reverse transcription-PCR. Equal amounts of each reaction were loaded on an agarose gel, and adenine phosphoribosyltransferase (APRT) was included as an internal control. C, Plants were grown exactly as in A, except that 600 μm Fe-EDTA was added on day 14 (instead of ferrozine). Expression levels of IRT1 and MAR1 are expressed as fold changes relative to their expression prior to Fe-EDTA treatment. [See online article for color version of this figure.]
Figure 10.
Figure 10.
Model for function of MAR1. Aminoglycoside antibiotics enter the chloroplast through the MAR1 transporter to gain access to their ribosomal targets (aminoglycosides bind the 30S ribosomal subunit where they induce misreading and/or premature termination; Recht et al., 1999). The mutant mar1-1 (indicated as mar1) is less functional, thus minimizing entry of antibiotics and conferring resistance. OM, Chloroplast outer membrane; IM, inner membrane; 30S, small ribosomal subunit; 50S, large ribosomal subunit; Ab, aminoglycoside antibiotic. [See online article for color version of this figure.]

Comment in

Similar articles

Cited by

References

    1. Aronsson H, Jarvis P (2002) A simple method for isolating import-competent Arabidopsis chloroplasts. FEBS Lett 529: 215–220 - PubMed
    1. Aufsatz W, Nehlin L, Voronin V, Schmidt A, Matzke A, Matzke M (2009) A novel strategy for obtaining kanamycin resistance in Arabidopsis thaliana by silencing an endogenous gene encoding a putative chloroplast transporter. Biotechnol J 4: 224–229 - PubMed
    1. Becker R, Fritz E, Manteuffel R (1995) Subcellular localization and characterization of excessive iron in the nicotianamine-less tomato mutant chloronerva. Plant Physiol 108: 269–275 - PMC - PubMed
    1. Boxall A, Johnson P, Smith E, Sinclair C, Stutt E, Levy L (2006) Uptake of veterinary medicines from soils into plants. J Agric Food Chem 54: 2288–2297 - PubMed
    1. Cassin G, Mari S, Curie C, Briat J, Czernic P (2009) Increased sensitivity to iron deficiency in Arabidopsis thaliana overaccumulating nicotianamine. J Exp Bot 60: 1249–1259 - PMC - PubMed

MeSH terms