. 2009 Oct;151(2):681-90.
doi: 10.1104/pp.109.139097. Epub 2009 Aug 12.

Analysis of PHOTOPERIOD SENSITIVITY5 sheds light on the role of phytochromes in photoperiodic flowering in rice

Affiliations

Analysis of PHOTOPERIOD SENSITIVITY5 sheds light on the role of phytochromes in photoperiodic flowering in rice

Fernando Andrés et al. Plant Physiol. 2009 Oct.

Abstract

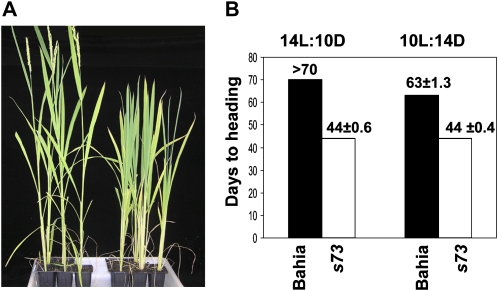
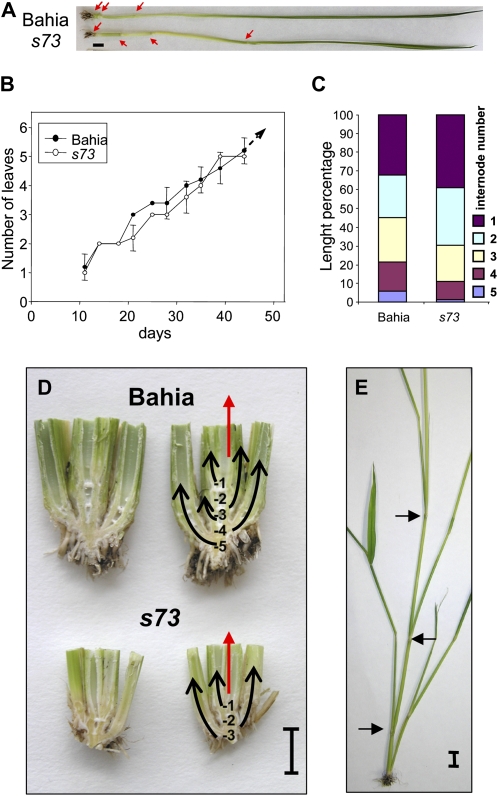
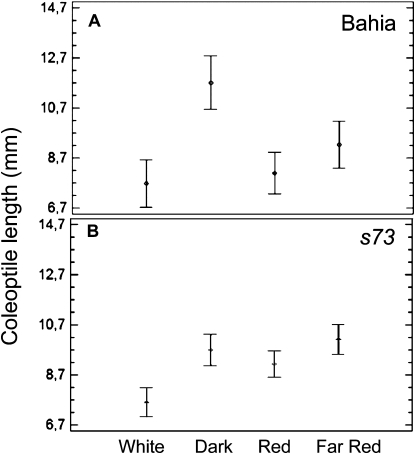
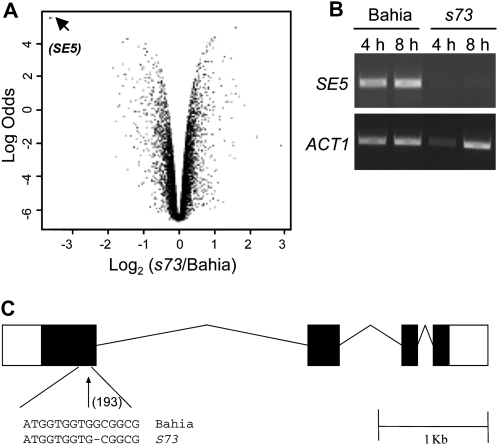
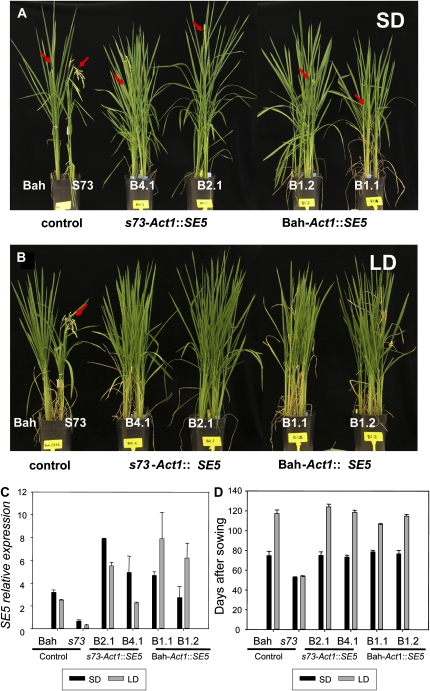
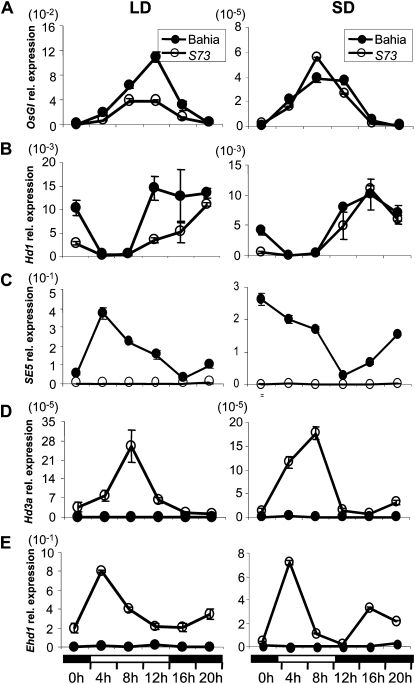
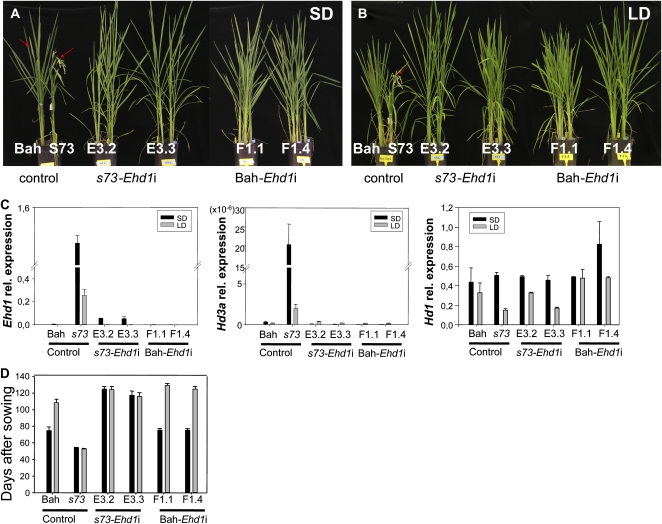
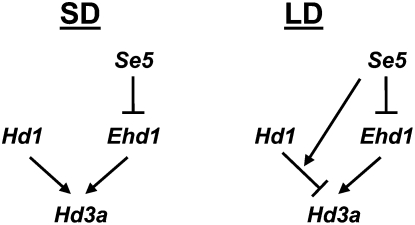
A great number of plants synchronize flowering with day length. In rice (Oryza sativa), photoperiod is the primary environmental cue that triggers flowering. Here, we show that the s73 mutant, identified in a gamma-irradiated Bahia collection, displays early flowering and photoperiodic insensitivity due to a null mutation in the PHOTOPERIOD SENSITIVITY5 (SE5) gene, which encodes an enzyme implicated in phytochrome chromophore biosynthesis. s73 mutant plants show a number of alterations in the characteristic diurnal expression patterns of master genes involved in photoperiodic control of flowering, resulting in up-regulation of the floral integrator Heading date3a (Hd3a). Early heading date1 (Ehd1), an additional rice floral activator, was also highly expressed in the s73 mutant, suggesting that SE5 represses Ehd1 in wild-type plants. Silencing of Ehd1 in both Bahia and s73 backgrounds indicated that SE5 regulates Ehd1 expression. The data also indicate that SE5 confers photoperiodic sensitivity through regulation of Hd1. These results provide direct evidence that phytochromes inhibit flowering by affecting both Hd1 and Ehd1 flowering pathways.


Figures

Figure 1.
Figure 1.
Comparison of the flowering phenotypes of the s73 mutant and the Bahia wild type. A, Phenotypes of s73 (left) and Bahia wild type (right). Plants were grown for 50 d under natural LD conditions (14 h light/10 h dark). s73 plants showed spikelets, whereas Bahia plants were still in the vegetative stage, and showed no signs of flowering. B, Flowering time under different photoperiod conditions. Days to flowering time were scored from germination to emergence of panicle (heading day) from the main culms under LD (14 h light/10 h dark [14L:10D]) and SD (10 h light/14 h dark [10L:14D]) conditions.
Figure 2.
Figure 2.
Comparison of developmental phenotypes of the s73 mutant with the Bahia wild type. A, Internode elongation of main culm of s73 and Bahia plants grown for 35 d. Leaves were removed to show the pattern of node elongation. Arrows indicate node positions (bar = 1 cm). B, Comparison of leaf emergence rates between Bahia and s73. The leaf number of individual plants was scored on the days indicated until panicle emergence in s73. The average leaf number under LD is plotted. Similar results were obtained under SD conditions (black circles, Bahia; white circles, s73). C, Internode lengths from adult plants expressed as a percentage of the final plant height. D, Longitudinal sections from basal portions of the main and secondary culms (red and black arrows, respectively). Numbers indicate node positions. E, s73 adult plant showing secondary stems in aerial nodes. Leaves were removed to reveal nodes (indicated by arrows). Bars in D and E = 1 cm.
Figure 3.
Figure 3.
Photomorphogenic responses of Bahia (A) and s73 (B) plants, grown in darkness, under white light or under red (15 min) or far-red (25 min) light treatments. Coleoptile lengths were measured after each treatment, and lsd intervals are provided (P = 0.05; n = 10).
Figure 4.
Figure 4.
Volcano plot analysis, mRNA expression, and genomic structure of SE5. A, Volcano plot analysis of the differentially expressed genes detected in the microarray experiment. Statistical significance (ordinate) is plotted against fold change (abscissa) for each probe. Fold changes are provided as a log2 scale [log2(s73/Bahia)]. The log odds score (ordinate) represents the probability that the gene is differentially expressed. Arrowhead corresponds to SE5 score. B, SE5 expression in Bahia and s73 plants. Adult plants were grown for 1 week under 12 h light/12 h darkness conditions. RNA was isolated from leaf samples taken at 4 and 8 h after light was turned on and SE5 expression was analyzed by semiquantitative RT-PCR. Act1 was used as the control. C, Genomic structure of SE5. s73 shows a 1-bp deletion at position 193, located inside the first exon. Black boxes represent exons; white boxes represent the 5′-untranslated region (left) and the 3′-untranslated region (right), respectively.
Figure 5.
Figure 5.
Phenotypic comparisons (left to right) of Bahia (Bah), s73, s73-Act1SE5 (lines B4.1 and B2.1), and Bahia-Act1SE5 (lines B1.2 and B1.1) plants overexpressing SE5. A and B, Plants grown under SD (A) and LD (B) conditions for 11 weeks. Bahia plants are at the heading stage. s73 plants showed mature panicles, whereas Bahia, s73-Act1SE5, and Bahia-Act1SE5 showed emergent panicles, indicated by red arrows. C, SE5 relative mRNA levels in Bahia, s73, and transgenic plants overexpressing SE5 quantified by quantitative RT-PCR. Plants were grown under neutral day (12 h light/12 h dark) conditions for 2 weeks, and for an additional week under SD (10 h light/14 h dark; dark bars) or LD (14 h light/10 h dark; open bars) conditions. Relative mRNA levels were normalized to total RNA amounts. D, Days to heading of the Bahia, s73, and transgenic plants overexpressing SE5 grown under SD or LD conditions (n = 8).
Figure 6.
Figure 6.
Diurnal expression patterns of OsGI (A), Hd1 (B), SE5 (C), Hd3a (D), and Ehd1 (E) in Bahia (black circles) and s73 (white circles) plants as indicated by quantitative RT-PCR results. Plants were grown under neutral day (12 h light/12 h dark) conditions for 3 weeks, and for an additional week under SD (10 h light/14 h dark) or LD (14 h light/10 h dark) conditions. In all sections, the mean of each point is based on the average of three biological replicates. Black bars indicate dark periods, and white bars indicate light periods. Relative mRNA levels normalized to total RNA amounts are shown. The values presented are the mean of two biological replicates. Error bars indicate sd from the mean.
Figure 7.
Figure 7.
Phenotypic comparisons (from left to right) of Bahia (Bah), s73, s73-Ehd1i (lines E3.2 and E3.3), and Bahia-Ehd1i (lines F1.1 and F1.4) plants. A, Plants growing under SD conditions. Pictures were taken when Bahia plants initiated the heading (11 weeks). s73 plants show mature panicles, whereas Bahia, s73-Ehd1i, and Bahia-Ehd1i show emergent panicles, indicated by red arrows. B, Plants growing under LD conditions. Pictures were taken 11 weeks after sowing. C, Ehd1, Hd3a, and Hd1 mRNA levels in Bahia, s73, and transgenic plants quantified by quantitative RT-PCR. Plants were grown under neutral day (12 h light/12 h dark) conditions for 2 weeks, and for an additional week under SD (10 h light/14 h dark) or LD (14 h light/10 h dark) conditions. RNA was isolated from leaf samples 4 h after the lights were turned on for Ehd1 and Hd3a analysis or 16 h for Hd1 analysis. Relative mRNA levels normalized to total RNA amounts are shown. Error bars indicate sd. D, Days to flowering of the Bahia, s73, s73-Ehd1i, and Bahia-Ehd1i p1ants grown under SD or LD conditions.
Figure 8.
Figure 8.
Schematic representation of the flowering-signal genetic pathways in rice in which SE5 acts as a repressor of Ehd1 expression. Under LD condition SE5 inhibits transcription of Hd3a, in an indirect manner through HD1.

Similar articles

Cited by

References

    1. Biswas KK, Neumann R, Haga K, Yatoh O, Iino M (2003) Photomorphogenesis of rice seedlings: a mutant impaired in phytochrome-mediated inhibition of coleoptile growth. Plant Cell Physiol 44: 242–254 - PubMed
    1. Conesa A, Gotees S, García-Gómez JM, Terol J, Talon M, Robles M (2005) Blast2GO: a universal annotation and visualization tool in functional genomics research. Application note. Bioinformatics 21: 3674–3676 - PubMed
    1. Corbesier L, Vincent C, Jang S, Fornara F, Fan Q, Searle I, Giakountis A, Farrona S, Gissot L, Turnbull C, et al (2007) FT protein movement contributes to long-distance signaling in floral induction of Arabidopsis. Science 316: 1030–1033 - PubMed
    1. Doi K, Izawa T, Fuse T, Yamanouchi U, Kubo T, Shimatani Z, Yano M, Yoshimura A (2004) Ehd1, a B-type response regulator in rice, confers short-day promotion of flowering and controls FT-like gene expression independently of Hd1. Gend Dev 18: 926–936 - PMC - PubMed
    1. Domingo C, Andrés F, Iglesias D, Tharreau D, Talón M (2009) Depletion of auxin content mediated by OsGH3.1 overexpression activates defense response and enhances resistance to fungal pathogen in rice. Mol Plant Microbe Interact 22: 201–210 - PubMed

Publication types

Associated data