

Memory-like CD8+ T cells generated during homeostatic proliferation defer to antigen-experienced memory cells
- PMID: 19675163
- PMCID: PMC2866069
- DOI: 10.4049/jimmunol.0900641
Memory-like CD8+ T cells generated during homeostatic proliferation defer to antigen-experienced memory cells
Abstract
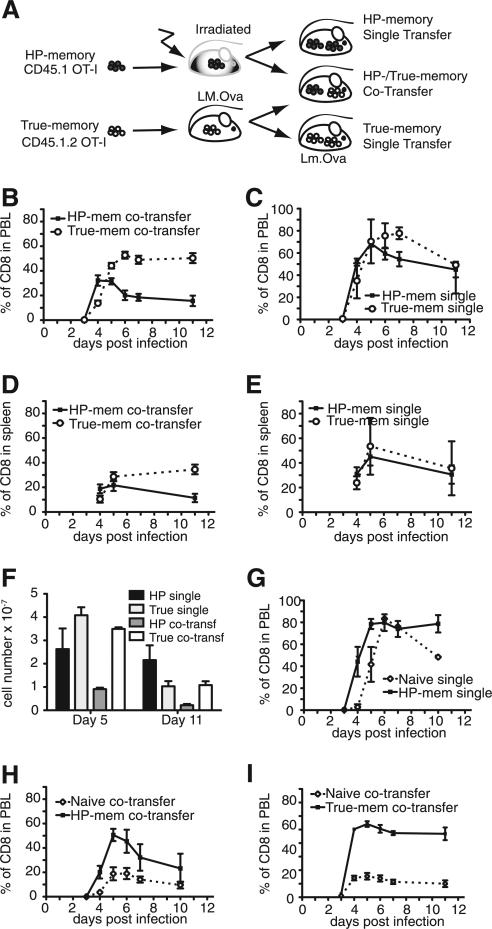
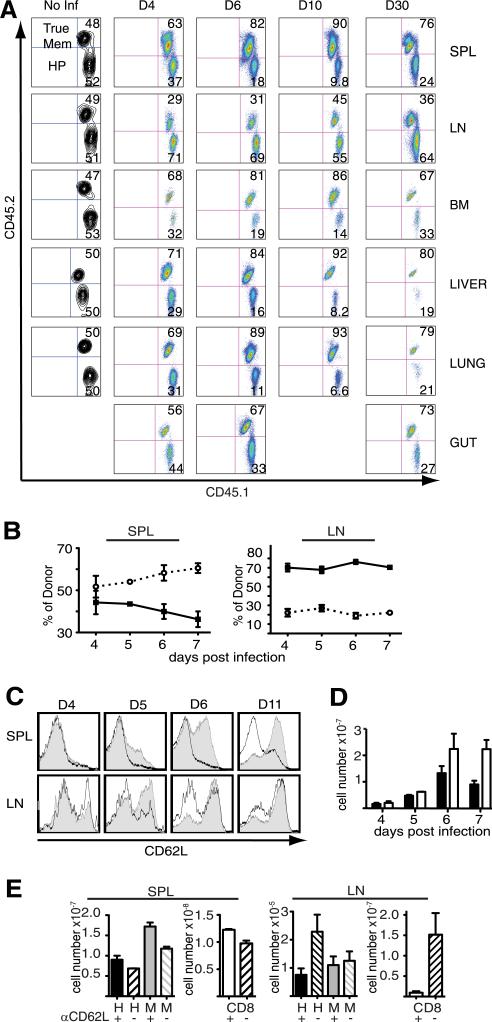
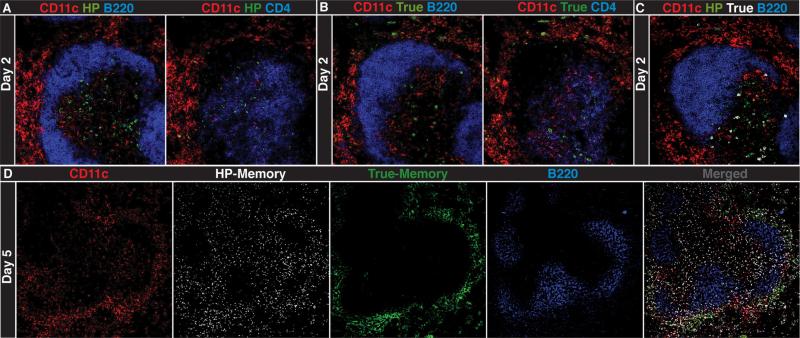
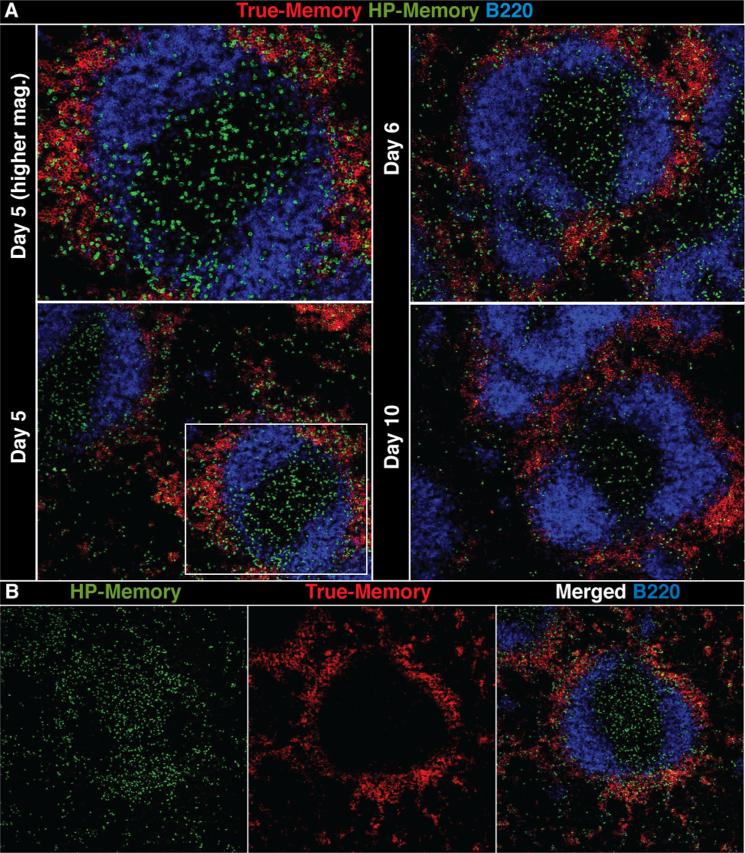
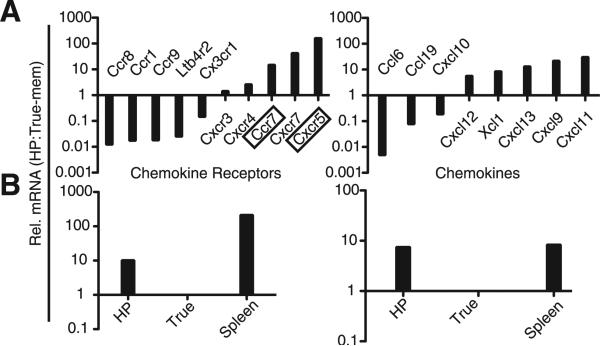
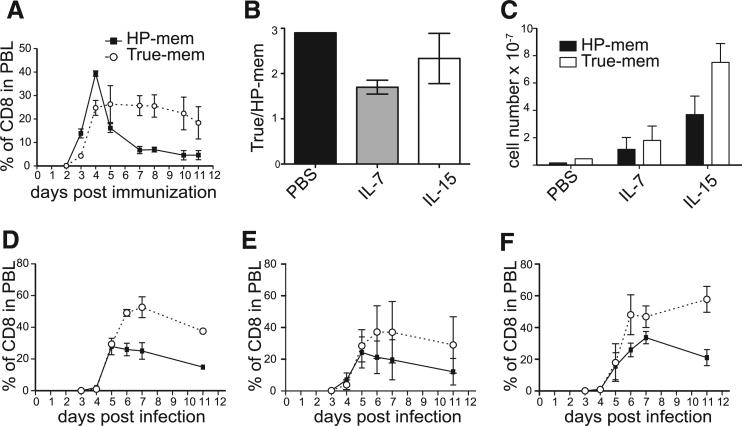
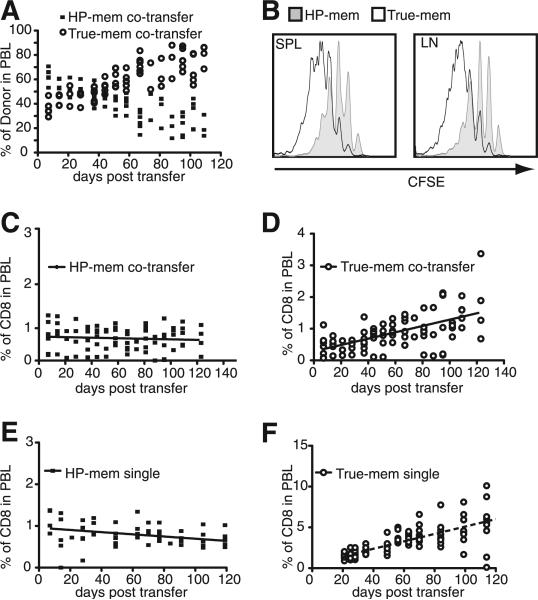
Naive T cells proliferate in response to lymphopenia and acquire the phenotypic and functional qualities of memory T cells, providing enhanced protection against infection. How well memory-like T cells generated during lymphopenia-induced homeostatic proliferation (HP)-memory differentiate into secondary memory cells and compete with Ag-experienced true-memory cells is unknown. We found that CD8(+) HP-memory T cells generated robust responses upon infection and produced a secondary memory population comparable to true-memory cells in the absence of competition. However, when true-memory and HP-memory T cells competed during infection, HP-memory cells contributed less to the effector population, contracted earlier, and formed fewer secondary memory cells. Furthermore, HP- and true-memory cells demonstrated distinct chemokine receptor expression and localization within the spleen during infection, indicating differential access to signals necessary for secondary memory formation. Thus, HP-memory T cells provide protection without compromising the true-memory population. Differences in HP- and true-memory T cells may reveal the basis of competition for limited resources within the memory-T cell compartment.
Figures
Similar articles
-
Homeostatic proliferation of a Qa-1b-restricted T cell: a distinction between the ligands required for positive selection and for proliferation in lymphopenic hosts.J Immunol. 2004 Nov 15;173(10):6065-71. doi: 10.4049/jimmunol.173.10.6065. J Immunol. 2004. PMID: 15528342
-
NK cells delay allograft rejection in lymphopenic hosts by downregulating the homeostatic proliferation of CD8+ T cells.J Immunol. 2010 Jun 15;184(12):6649-57. doi: 10.4049/jimmunol.0903729. Epub 2010 May 14. J Immunol. 2010. PMID: 20483732
-
Cutting edge: IL-7-dependent homeostatic proliferation of CD8+ T cells in neonatal mice allows the generation of long-lived natural memory T cells.J Immunol. 2004 Jan 1;172(1):15-9. doi: 10.4049/jimmunol.172.1.15. J Immunol. 2004. PMID: 14688303
-
Stem cell-like plasticity of naïve and distinct memory CD8+ T cell subsets.Semin Immunol. 2009 Apr;21(2):62-8. doi: 10.1016/j.smim.2009.02.004. Epub 2009 Mar 9. Semin Immunol. 2009. PMID: 19269852 Review.
-
Cytokine synergy in antigen-independent activation and priming of naive CD8+ T lymphocytes.Crit Rev Immunol. 2009;29(3):219-39. doi: 10.1615/critrevimmunol.v29.i3.30. Crit Rev Immunol. 2009. PMID: 19538136 Review.
Cited by
-
Sustained and incomplete recovery of naive CD8+ T cell precursors after sepsis contributes to impaired CD8+ T cell responses to infection.J Immunol. 2013 Mar 1;190(5):1991-2000. doi: 10.4049/jimmunol.1202379. Epub 2013 Jan 25. J Immunol. 2013. PMID: 23355736 Free PMC article.
-
Virtual memory CD8 T cells display unique functional properties.Proc Natl Acad Sci U S A. 2013 Aug 13;110(33):13498-503. doi: 10.1073/pnas.1307572110. Epub 2013 Jul 29. Proc Natl Acad Sci U S A. 2013. PMID: 23898211 Free PMC article.
-
The Goldilocks Window of Personalized Chemotherapy: Getting the Immune Response Just Right.Cancer Res. 2019 Oct 15;79(20):5302-5315. doi: 10.1158/0008-5472.CAN-18-3712. Epub 2019 Aug 6. Cancer Res. 2019. PMID: 31387920 Free PMC article.
-
Sublethal whole-body irradiation induces permanent loss and dysfunction in pathogen-specific circulating memory CD8 T cell populations.Proc Natl Acad Sci U S A. 2023 Jul 4;120(27):e2302785120. doi: 10.1073/pnas.2302785120. Epub 2023 Jun 26. Proc Natl Acad Sci U S A. 2023. PMID: 37364124 Free PMC article.
-
Defining the Molecular Hallmarks of T-Cell Memory.Cold Spring Harb Perspect Biol. 2022 Mar 1;14(3):a037804. doi: 10.1101/cshperspect.a037804. Cold Spring Harb Perspect Biol. 2022. PMID: 34127444 Free PMC article. Review.
References
Publication types
MeSH terms
Substances
Grants and funding
LinkOut - more resources
Full Text Sources
Research Materials
Miscellaneous
