Comparative Study
. 2009 Sep 1;183(5):3177-87.
doi: 10.4049/jimmunol.0804233. Epub 2009 Aug 12.

Modulation of single-cell IgG secretion frequency and rates in human memory B cells by CpG DNA, CD40L, IL-21, and cell division

Affiliations
Comparative Study

Modulation of single-cell IgG secretion frequency and rates in human memory B cells by CpG DNA, CD40L, IL-21, and cell division

Alicia D Henn et al. J Immunol. .

Abstract

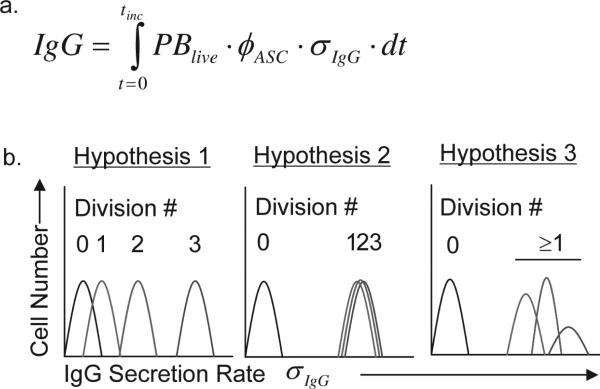
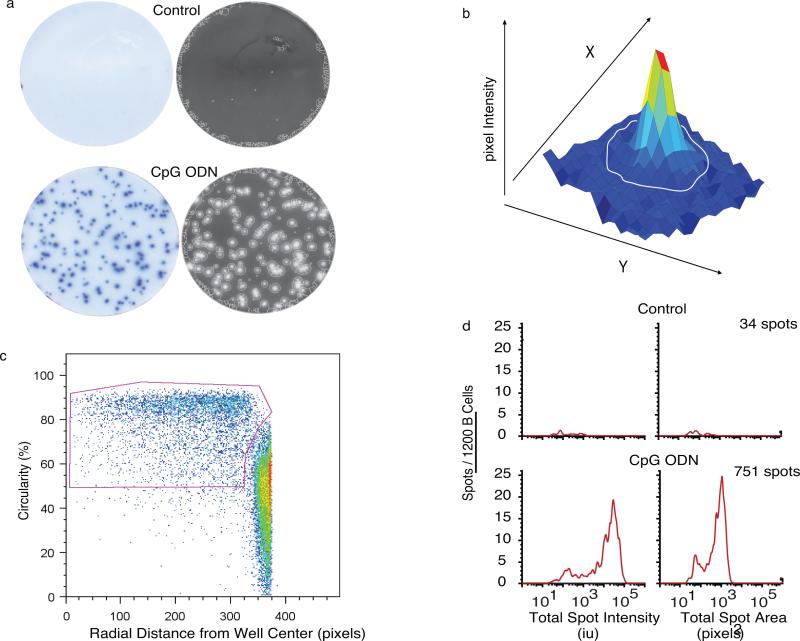
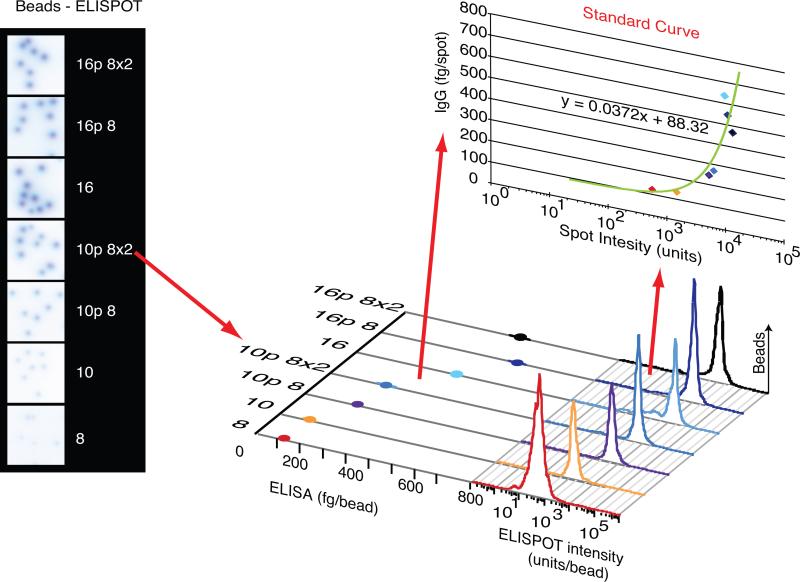
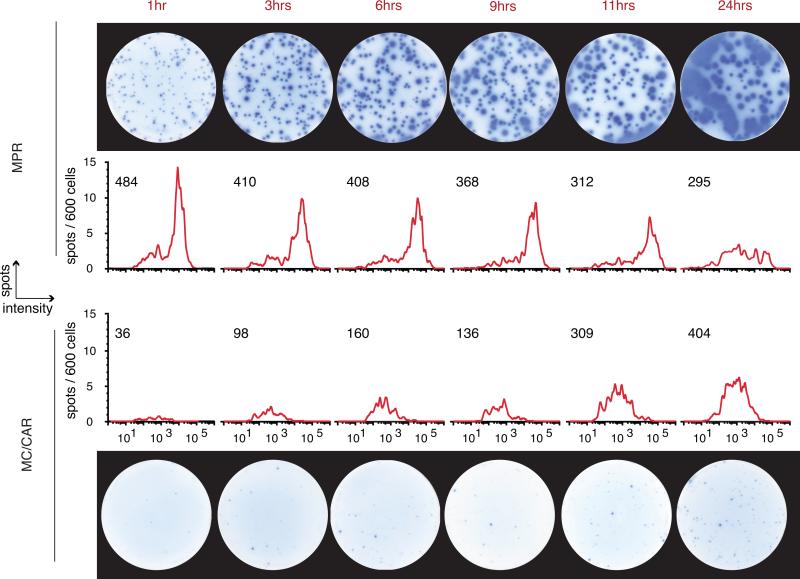
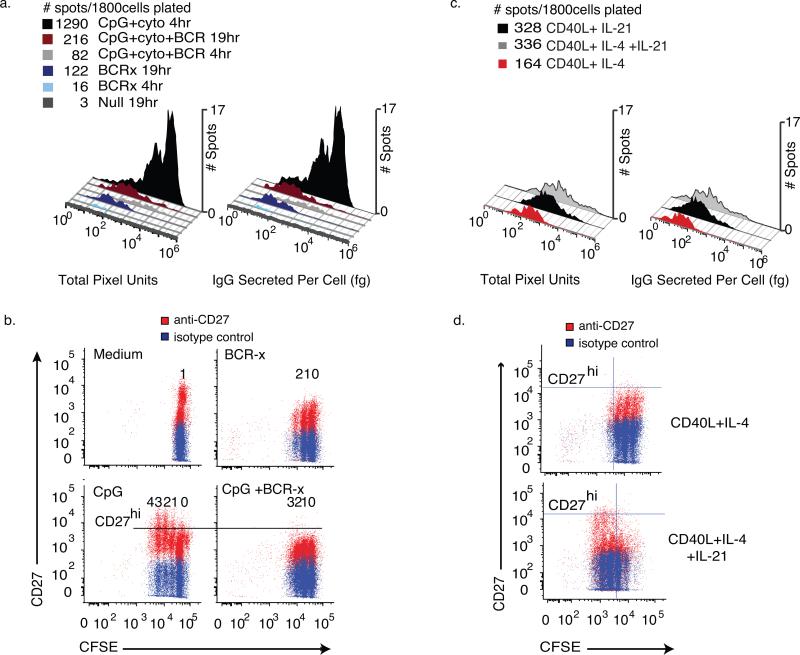
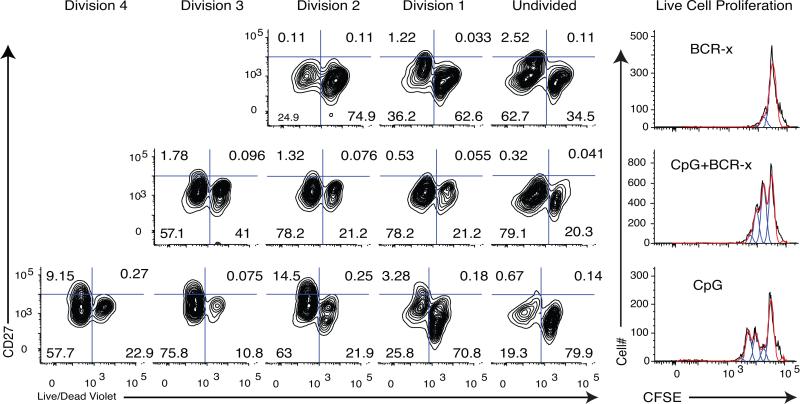
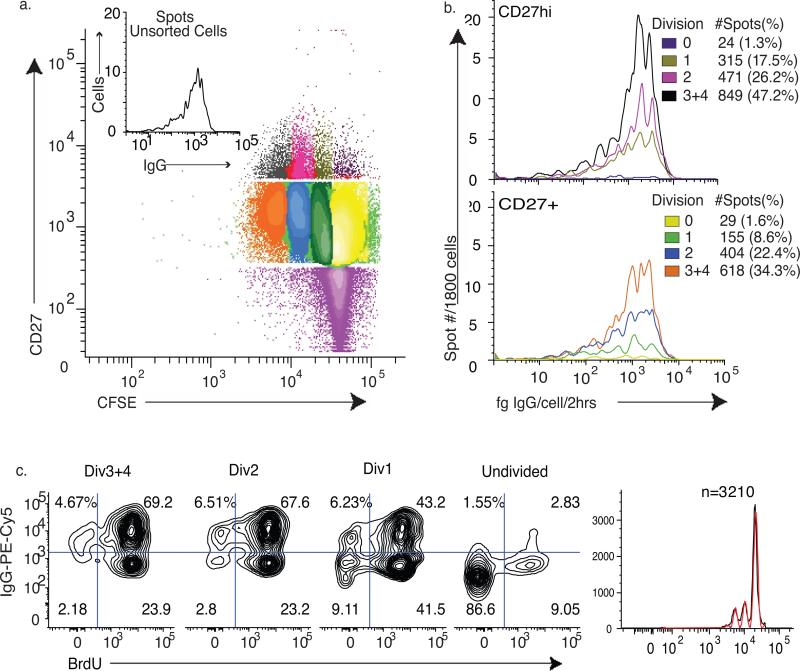
During the recall response by CD27(+) IgG class-switched human memory B cells, total IgG secreted is a function of the following: 1) the number of IgG-secreting cells (IgG-SC), and 2) the secretion rate of each cell. In this study, we report the quantitative ELISPOT method for simultaneous estimation of single-cell IgG secretion rates and secreting cell frequencies in human B cell populations. We found that CD27(+) IgM(-) memory B cells activated with CpG and cytokines had considerable heterogeneity in the IgG secretion rates, with two major secretion rate subpopulations. BCR cross-linking reduced the frequency of cells with high per-cell IgG secretion rates, with a parallel decrease in CD27(high) B cell blasts. Increased cell death may account for the BCR-stimulated reduction in high-rate IgG-SC CD27(high) B cell blasts. In contrast, the addition of IL-21 to CD40L plus IL-4-activated human memory B cells induced a high-rate IgG-SC population in B cells with otherwise low per-cell IgG secretion rates. The profiles of human B cell IgG secretion rates followed the same biphasic distribution and range irrespective of division class. This, along with the presence of non-IgG-producing, dividing B cells in CpG plus cytokine-activated B memory B cell populations, is suggestive of an on/off switch regulating IgG secretion. Finally, these data support a mixture model of IgG secretion in which IgG secreted over time is modulated by the frequency of IgG-SC and the distribution of their IgG secretion rates.


Figures

Figure 1a
Figure 1a. An equation to describe how individual B cells contribute to total IgG production within a population
IgG is the total IgG secreted, PBlive is the number of live B cell blasts, φASC is the fraction of live cells that are secreting IgG, σIgG is the rate of IgG secretion per cell, t is time and tinc is the incubation time of the assay. 1b. Hypotheses for the relationship between cell division and IgG secretion range of B cell populations. The secretion rate maturation hypothesis posits that memory B cells stimulated to differentiate into B cell blasts increase their σIgG with each subsequent mitosis such that cells that have divided more times secrete IgG at a higher σIgG. An alternative possibility is that σIgG are independent of division class, behaving more like a binary “On/Off” switch. In this model, dividing cells secrete IgG in the same range, irregardless of division number and control of population IgG secretion is asserted through control of φASC. In the third “mixture” hypothesis, several subpopulations of memory B cell blasts produce different σIgG distributions.
Figure 2
Figure 2. Bimodal Distribution of the IgG ELISPOTs in CpG+CK-stimulated memory B cells
Unstimulated and CpG+CK-stimulated human IgG depleted CD27+ memory B cells, were incubated in ELISPOT plates for 6 hours. (a) Raw and EXPLORAspot-processed representative ELISPOT well images selected from 9 independent experiments (3-6 replicate wells per experiment) show that CpG+CK-stimulation increased the amount of IgG secreted as well as the number of cells secreting IgG (p<0.001). The EXPLORAspot software detected the circled spots. To eliminate well-edge artifacts, all spots data from each 96 well plate were pooled and FACS analysis software used to create a bivariate plot of the radial distance of each spot from the center of the well versus spot circularity. (b) A three-dimensional plot showing x and y coordinates used for spot area calculation. Spot intensity is the sum of spot pixel values (defined in arbitrary intensity units: Int-U) which are represented here by the z-axis. (c) Gating strategy that maximized retention of circular “true” spots at well edges, while eliminating less circular well edge artifact. (d) Histograms of pooled spot populations from 6 replicate wells including the wells pictured in 2a showing that spot numbers increased 20-fold in response to CpG+CK stimulation. Spot total intensity values also increase with some heterogeneity in IgG spot sizes over the population.
Figure 3
Figure 3. Bead-mediated Estimation of IgG Release
Sampled well images with spots produced by human IgG released from different sizes of polymer beads. Spot size and ELISA data quantitating IgG release from the same bead samples were plotted to construct a standard curve describing the mathematical relationship between spot size and IgG released per bead. This standard curve could then be used to assign absolute IgG secretion rates to individual spots in the experiment.
Figure 4
Figure 4. The mathematical relationship between the spot area and total intensity
The means of the areas and total spot intensity values of spots generated by low-rate (MC/CAR) and high-rate (MPR1130) IgG-secreting control myeloma cells lines as well as IgG-releasing beads were compared. A direct relationship between spot area and total intensity can be seen, whether the spot was formed by cells or by beads. Therefore, either parameter could be used for comparison to IgG released by ELISA. Three-dimensional well images indicating changes in spot morphology with increasing spot size are also shown.
Figure 5
Figure 5. Spot Development Over Time of Incubation (tinc)
A time course showing well images and matching spot intensity histograms of two myeloma cell lines secreting IgG at a high and a low rate. At time points beyond 6 hours, spots detected from the high-rate secreting cell line MPR spot begin to merge and then cannot be accurately analyzed. Beyond 12 hours, the low-secreting myeloma cells are still producing spots that are coming into detectable range of sizes, so time is a critical factor in these studies. The effective range of total spot intensity values detected was 30 to 2×10⁵ INT-U.
Figure 6
Figure 6. Estimating IgG release from individual cells in mixed populations of responding memory B cells
Human CD27+ memory cells depleted of IgM+ B cells were isolated and split into groups cultured with medium, CpG2006 ODN and cytokines (CpG+ck) and BCR-crosslinking antibodies (BCR-x), alone or in combination. After 96 hours of culture, the cells were washed and assayed for IgG secretion in paired ELISA and ELISPOT assays next to wells pre-spotted with bead standards for IgG release. Cells were incubated in the assay plates for 4 hours or 19hours (N=6wells, 300 live cells/well). Using a bead-derived standard curve as in Fig. 4, values for IgG secreted were calculated. (a) Histograms of raw spot intensity and estimated IgG secretion. The addition of BCR-crosslinking antibodies to the CpG+CK stimulation conditions reduced the number of high- σIgG IgG-SC by 92.7 ± 4.73% and low range σIgG IgG-SC by 53.3 ± 18.7%. Spots on plates allowed to incubate 19hrs show low σIgG (IgG<1000 fg•cell−1) cell populations more clearly. (b) Flow cytometric analysis of IgMneg memory B cells stained with CFSE at isolation, stimulated with CpG+CK stained for viability and CD27 cell surface marker expression after 72 hours of incubation. Undivided cells are seen as the population furthest to the right, each division producing an additional population with reduced CFSE staining. With each generation, an increase in CD27high proliferating B cell blasts can be seen in CpG+CK-stimulated cells and the number of CD27high cells is reduced by the addition of BCR-x. (c) Spot Intensity and estimated IgG secreted per cell histograms of IgM-depleted CD19+CD27+ memory B cells that had been stimulated with CD40L-expressing fibroblasts and rhuIL-4 or rhuIL-21, alone or in combination for 96 hours, washed and assayed as in figure 6a. CD40L and IL-4 stimulation yielded low σIgG IgG-SC. Activation by CD40L+IL-21, with or without IL-4 induced a small population of high σIgG IgG-SC and increased total spot numbers. (d) CFSE vs CD27 expression of cells treated as in (c). In cell populations treated with IL-21, more cell division is evident and CD27 expression increases in dividing cells, consistent with development of a B cell blast phenotype.
Figure 7
Figure 7. Increased cell death in later divisions of CpG+CK+BCR-x stimulated cells
IgMneg memory B cells were isolated from the donor and split into treatment groups, with medium alone (Unstimulated), BCR-x, CpG+CK, and CpG+CK+BCR-x. After 72 hours in culture, the cells were stained for cell surface CD27 and live/dead violet dye (representative of 3 experiments). Dead cells retain this dye, appearing to the right in these figures. CpG+CK treatment produced more dead cells in Undivided and Division 1 populations. Addition of BCR-x to CpG+CK changed this profile to favor more live cells in undivided populations and more dead cells in later divisions. This suggests that reduced numbers of high-rate IgG-SC and reduced B cell blasts in CpG+CK+BCR-x may be due to higher death rates.
Figure 8
Figure 8. Binary On/Off IgG Secretion
IgMneg Memory B cells were stained with CFSE, then stimulated with CpG+CK conditions for 72 hours. (a) IgG secretion of unsorted cells and gating figure for sorting. The cells were sorted first based on CD27 expression and then on CFSE content. The cells were counted and viability determined post-sort. (b) Of each fraction, 1800 live cells were plated in 6 wells at 300 cells/well for ELISPOT assay. Beads released IgG into other wells on each plate for standard curve generation. While the overall distribution of IgG secretion rates in each fraction remained the same, the frequency of IgG secreting cells and the preponderance of high-rate IgG-SC increased with division (N=4 experiments). Number of IgG-SC is shown as # spots (with % of cells plated) (c). IgMneg memory B cells were stained with CFSE, incubated with BrdU under CpG+CK stimulation conditions for 69 hours. At harvest, the cells were fixed and stained for intracellular IgG and BrdU content. There are IgG positive and negative cells in each generation and the percent of IgG positive cells increases in each cell division, paralleling the increase in IgG secretion seen in Fig. 7. This suggests that not all cells produce IgG, even though they are dividing. Cells that remain undivided have a low percentage of IgG positive cells.

Similar articles

Cited by

References

    1. Tangye SG, Avery DT, Hodgkin PD. A division-linked mechanism for the rapid generation of Ig-secreting cells from human memory B cells. J Immunol. 2003;170:261–269. - PubMed
    1. Hemmi H, Takeuchi O, Kawai T, Kaisho T, Sato S, Sanjo H, Matsumoto M, Hoshino K, Wagner H, Takeda K, Akira S. A Toll-like receptor recognizes bacterial DNA. Nature. 2000;408:740–745. - PubMed
    1. Bernasconi NL, Traggiai E, Lanzavecchia A. Maintenance of serological memory by polyclonal activation of human memory B cells. Science. 2002;298:2199–2202. - PubMed
    1. Huggins J, Pellegrin T, Felgar RE, Wei C, Brown M, Zheng B, Milner EC, Bernstein SH, Sanz I, Zand MS. CpG DNA activation and plasma-cell differentiation of CD27- naive human B cells. Blood. 2007;109:1611–1619. - PMC - PubMed
    1. Shiao RT, McLeskey SB, Khera SY, Wolfson A, Freter CE. Mechanisms of inhibition of IL-6-mediated immunoglobulin secretion by dexamethasone and suramin in human lymphoid and myeloma cell lines. Leukemia & lymphoma. 1996;21:293–303. - PubMed

Publication types

MeSH terms