

Adaptation of the length-active tension relationship in rabbit detrusor
- PMID: 19675182
- PMCID: PMC2775573
- DOI: 10.1152/ajprenal.00298.2009
Adaptation of the length-active tension relationship in rabbit detrusor
Abstract
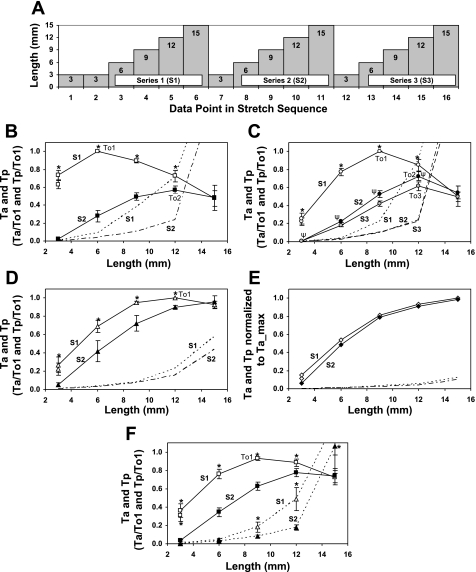
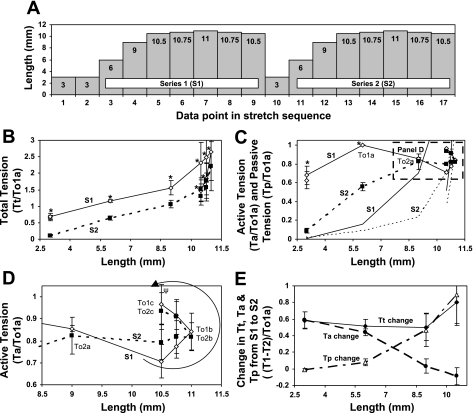
Studies have shown that the length-tension (L-T) relationships in airway and vascular smooth muscles are dynamic and can adapt to length changes over a period of time. Our prior studies have shown that the passive L-T relationship in rabbit detrusor smooth muscle (DSM) is also dynamic and that DSM exhibits adjustable passive stiffness (APS) characterized by a passive L-T curve that can shift along the length axis as a function of strain history and activation history. The present study demonstrates that the active L-T curve for DSM is also dynamic and that the peak active tension produced at a particular muscle length is a function of both strain and activation history. More specifically, this study reveals that the active L-T relationship, or curve, does not have a unique peak tension value with a single ascending and descending limb, but instead reveals that multiple ascending and descending limbs can be exhibited in the same DSM strip. This study also demonstrates that for DSM strips not stretched far enough to reveal a descending limb, the peak active tension produced by a maximal KCl-induced contraction at a short, passively slack muscle length of 3 mm was reduced by 58.6 +/- 4.1% (n = 15) following stretches to and contractions at threefold the original muscle length, 9 mm. Moreover, five subsequent contractions at the short muscle length displayed increasingly greater tension; active tension produced by the sixth contraction was 91.5 +/- 9.1% of that produced by the prestretch contraction at that length. Together, these findings indicate for the first time that DSM exhibits length adaptation, similar to vascular and airway smooth muscles. In addition, our findings demonstrate that preconditioning, APS and adaptation of the active L-T curve can each impact the maximum total tension observed at a particular DSM length.
Figures


Similar articles
-
Carbachol-induced volume adaptation in mouse bladder and length adaptation via rhythmic contraction in rabbit detrusor.Ann Biomed Eng. 2012 Oct;40(10):2266-76. doi: 10.1007/s10439-012-0590-8. Epub 2012 May 22. Ann Biomed Eng. 2012. PMID: 22614640
-
Length adaptation of the passive-to-active tension ratio in rabbit detrusor.Ann Biomed Eng. 2010 Aug;38(8):2594-605. doi: 10.1007/s10439-010-0021-7. Epub 2010 Apr 13. Ann Biomed Eng. 2010. PMID: 20387122
-
Adjustable passive length-tension curve in rabbit detrusor smooth muscle.J Appl Physiol (1985). 2007 May;102(5):1746-55. doi: 10.1152/japplphysiol.00548.2006. Epub 2007 Jan 18. J Appl Physiol (1985). 2007. PMID: 17234807
-
Smooth muscle physiology and effect of bladder and urethra muscle length/tension on response to stimulation. Part I. Review.Urology. 1980 Sep;16(3):323-30. doi: 10.1016/0090-4295(80)90059-x. Urology. 1980. PMID: 6999701 Review.
-
In vitro responses of detrusor smooth muscle to stretch and relaxation.Scand J Urol Nephrol Suppl. 1999;201:5-11. doi: 10.1080/003655999750042088. Scand J Urol Nephrol Suppl. 1999. PMID: 10573770 Review.
Cited by
-
A new and automated method for objective analysis of detrusor rhythm during the filling phase.World J Urol. 2014 Feb;32(1):85-90. doi: 10.1007/s00345-013-1084-5. Epub 2013 Apr 30. World J Urol. 2014. PMID: 23633125
-
Vascular mechanotransduction.Physiol Rev. 2023 Apr 1;103(2):1247-1421. doi: 10.1152/physrev.00053.2021. Epub 2023 Jan 5. Physiol Rev. 2023. PMID: 36603156 Free PMC article. Review.
-
A constrained mixture-micturition-growth (CMMG) model of the urinary bladder: Application to partial bladder outlet obstruction (BOO).J Mech Behav Biomed Mater. 2022 Oct;134:105337. doi: 10.1016/j.jmbbm.2022.105337. Epub 2022 Jun 30. J Mech Behav Biomed Mater. 2022. PMID: 35863296 Free PMC article.
-
Active tension adaptation at a shortened arterial muscle length: inhibition by cytochalasin-D.Am J Physiol Heart Circ Physiol. 2011 Apr;300(4):H1166-73. doi: 10.1152/ajpheart.00009.2010. Epub 2011 Jan 14. Am J Physiol Heart Circ Physiol. 2011. PMID: 21239639 Free PMC article.
-
Bladder attack: transient bladder ischemia leads to a reversible decrease in detrusor compliance.Transl Androl Urol. 2019 Dec;8(6):703-711. doi: 10.21037/tau.2019.11.12. Transl Androl Urol. 2019. PMID: 32038967 Free PMC article.
References
-
- Abrams P, Wein AJ. Introduction: overactive bladder and its treatment. Urology 55: 1–2, 2000 - PubMed
-
- Ali F, Chin L, Pare PD, Seow CY. Mechanism of partial adaptation in airway smooth muscle after a step change in length. J Appl Physiol 103: 569–577, 2007 - PubMed
-
- Ali F, Pare PD, Seow CY. Models of contractile units and their assembly in smooth muscle. Can J Physiol Pharmacol 83: 825–831, 2005 - PubMed
-
- Bai TR, Bates JH, Brusasco V, Camoretti-Mercado B, Chitano P, Deng LH, Dowell M, Fabry B, Ford LE, Fredberg JJ, Gerthoffer WT, Gilbert SH, Gunst SJ, Hai CM, Halayko AJ, Hirst SJ, James AL, Janssen LJ, Jones KA, King GG, Lakser OJ, Lambert RK, Lauzon AM, Lutchen KR, Maksym GN, Meiss RA, Mijailovich SM, Mitchell HW, Mitchell RW, Mitzner W, Murphy TM, Pare PD, Schellenberg RR, Seow CY, Sieck GC, Smith PG, Smolensky AV, Solway J, Stephens NL, Stewart AG, Tang DD, Wang L. On the terminology for describing the length-force relationship and its changes in airway smooth muscle. J Appl Physiol 97: 2029–2034, 2004 - PubMed
-
- Bosse Y, Sobieszek A, Pare PD, Seow CY. Length adaptation of airway smooth muscle. Proc Am Thorac Soc 5: 62–67, 2008 - PubMed
Publication types
MeSH terms
Grants and funding
LinkOut - more resources
Full Text Sources
Miscellaneous