. 2009 Aug 12;29(32):9977-86.
doi: 10.1523/JNEUROSCI.3893-08.2009.

BC1 regulation of metabotropic glutamate receptor-mediated neuronal excitability

Affiliations

BC1 regulation of metabotropic glutamate receptor-mediated neuronal excitability

Jun Zhong et al. J Neurosci. .

Abstract

Regulatory RNAs have been suggested to contribute to the control of gene expression in eukaryotes. Brain cytoplasmic (BC) RNAs are regulatory RNAs that control translation initiation. We now report that neuronal BC1 RNA plays an instrumental role in the protein-synthesis-dependent implementation of neuronal excitation-repression equilibria. BC1 repression counter-regulates translational stimulation resulting from synaptic activation of group I metabotropic glutamate receptors (mGluRs). Absence of BC1 RNA precipitates plasticity dysregulation in the form of neuronal hyperexcitability, elicited by group I mGluR-stimulated translation and signaled through the mitogen-activated protein kinase kinase/extracellular signal-regulated kinase pathway. Dysregulation of group I mGluR function in the absence of BC1 RNA gives rise to abnormal brain function. Cortical EEG recordings from freely moving BC1(-/-) animals show that group I mGluR-mediated oscillations in the gamma frequency range are significantly elevated. When subjected to sensory stimulation, these animals display an acute group I mGluR-dependent propensity for convulsive seizures. Inadequate RNA control in neurons is thus causally linked to heightened group I mGluR-stimulated translation, neuronal hyperexcitability, heightened gamma band oscillations, and epileptogenesis. These data highlight the significance of small RNA control in neuronal plasticity.


Figures
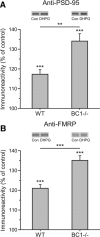
Figure 1.
Figure 1.
Lack of BC1 RNA causes upregulation of mGluR-stimulated translation. A, Western blot analysis of hippocampal slice lysates probed with an antibody against PSD-95. Hippocampal slices obtained from WT or BC1 −/− animals were incubated in ACSF with or without 100 μm DHPG for 30 min. DHPG exposure increased expression levels of PSD-95 in samples from WT and BC1 −/− animals (p < 0.001, compared with basal expression levels, Student's t test), and the increase in BC1 −/− preparations (34 ± 4%; n = 8) was significantly larger than that in WT preparations (17 ± 2%; n = 8; p < 0.01, Student's t test). B, Western blot analysis of hippocampal slice lysates probed with an antibody against FMRP. FMRP expression levels were increased by DHPG in WT and BC1 −/− slices (p < 0.001, compared with basal levels, Student's t test). Similar to the PSD-95 increase shown in A, the increase in BC1 −/− preparations (35 ± 2%; n = 8) was significant larger than that in WT preparations (21 ± 2%; n = 8; p < 0.001, Student's t test). Error bars indicate SEM, and n indicates number of animals used. Representative Western blot results are shown above each bar diagram. Asterisks above bars indicate significant differences compared with basal levels (not DHPG-stimulated, normalized to 100%), and asterisks above brackets indicate significant differences between animal groups. Con, Control. In this and all subsequent figures, levels of significance are defined as follows: *p < 0.05, **p < 0.01, ***p < 0.001.
Figure 2.
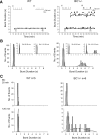
Figure 2.
Activation of glutamatergic synapses induces prolonged synchronized discharges in BC1 −/− hippocampal slices. Results from WT slices are shown on the left, and results from BC1 −/− slices are shown on the right. Bic (50 μm) was applied at t = 0. A, The graphs plot the duration of each population burst recorded in the cells over time. In WT preparations, only short-duration bursts (<1.5 s) were induced by bicuculline and persisted for >2 h. In the BC1 −/− preparation, after an initial period during which only short duration bursts were recorded, discharges of prolonged duration (∼5 s) appeared ∼40 min after application of bicuculline. Insets i and ii show the intracellular recording of rhythmic bursts of action potentials obtained in CA3 pyramidal cells at the times indicated. Resting membrane potential: WT at 20 and 120 min Bic, −63 and −61 mV, respectively; BC1 −/− at 20 and 120 min Bic, −64 and −62 mV, respectively. Input resistance: WT at 20 and 120 min Bic, 35 and 33 MΩ, respectively; BC1 −/− at 20 and 120 min Bic, 30 and 31 MΩ, respectively. B, Frequency histograms of burst durations for the experiments shown in A. Second-order Gaussian function fits of frequency histogram distributions are shown in all plots. Insets show average burst durations in the interval 20–35 min for WT (mean ± SEM, 0.391 ± 0.008 s; n = 27) and BC1 −/− (0.420 ± 0.018 s; n = 30) and in the interval 115–130 min for WT (0.407 ± 0.006 s; n = 33) and BC1 −/− (3.154 ± 0.485 s; n = 28). Prolongation of average burst duration in the BC1 −/− 115–130 min interval was attributable to the appearance of a distinct group of long bursts (5.475 ± 0.124 s; n = 15). Burst duration in the BC1 −/− preparation was significantly longer at 115–130 min of bicuculline than at 20–35 min in the same slice (Student's t test for unpaired data, p < 0.001) and also significantly longer than at 115–130 min in a WT preparation (p < 0.001). For the WT preparation, burst duration did not change significantly over the recording period (Student's t test for unpaired data, p = 0.115). C, Summary frequency histograms recorded in five WT and six BC1 −/− slice preparations (1 slice per animal) at the times indicated. Bursts of prolonged duration (>1.5 s) were recorded in all BC1 −/− hippocampal slices after 120 min of bicuculline but never in WT preparations.
Figure 3.
Figure 3.
Group I mGluR signaling is required to trigger neuronal hyperexcitability elicited in the absence of BC1 RNA. A, Prolonged synchronized discharges in hippocampal slices recorded at 120 min after perfusion with bicuculline were suppressed by the mGluR1 antagonist LY367385 (50 μm, top left) and the mGluR5 antagonist MPEP (50 μm, bottom left). Right panel shows a summary plot of average burst durations at times indicated. Extended bicuculline exposure prolonged bursts (Bic 30 min, 0.830 ± 0.241 s; Bic 120 min, 3.776 ± 0.423 s; n = 3; filled circles; two-way ANOVA, post hoc Newman–Keuls test, p < 0.01). These prolonged bursts were subsequently shortened by LY367385, within 30 min, to 0.622 ± 0.058 s (p < 0.01). Similarly, bursts of 0.347 ± 0.006 s (Bic 30 min; n = 3; open circles), after having been prolonged by bicuculline to 3.538 ± 0.117 s (Bic 120 min; n = 3; open circles; p < 0.01), were shortened by MPEP within 30 min to 0.718 ± 0.073 s (p < 0.01). Statistical analysis revealed no significant differences between durations of bursts recorded in the presence of antagonists (LY367385 or MPEP) and those recorded at 30 min bicuculline. B, Suppression of prolonged synchronized discharges by mGluR5 antagonist MPEP is reversible. Prolonged synchronized discharges recorded 120 min after bicuculline application were completely suppressed 30 min after application of 50 μm MPEP (left). Prolonged synchronized discharges reappeared within 60 min after MPEP washout. The bar graph on the right shows the summary data of burst durations recorded at 120 min in Bic (2.935 ± 0.185 s; n = 4), 30 min Bic plus MPEP (0.628 ± 0.026 s; p < 0.01), and 60 min after MPEP washout (3.470 ± 0.257 s; p = 0.1). Error bars indicate SEM.
Figure 4.
Figure 4.
Hyperexcitability in the absence of BC1 RNA depends on MEK–ERK signaling and protein synthesis. A, Intracellular recordings of the spontaneous activities in BC1 −/− CA3 pyramidal cells after 30 and 90 min of perfusion with 50 μm bicuculline. Slices were held in ACSF, in the presence of 20 μm anisomycin, or in the presence of 50 μm MEK1/2 inhibitor PD98059. Pretreatment (1 h) of BC1 −/− slices with either anisomycin or PD98059 prevented synaptic induction of prolonged synchronized discharges. B, Summary data of burst durations recorded at 30 min (white bars) and 90 min (gray bars) in ACSF (n = 7) and anisomycin-pretreated (n = 6) and PD98059-pretreated (n = 5) conditions (**p < 0.01, Student's t test for paired data). The MEK1/2 inhibitor U0126 (20 μm) produced results analogous to PD98059 (data not shown). C, Top, Prolonged synchronized discharges in BC1 −/− preparations, manifest 90 min after application of 50 μm bicuculline, were not suppressed by perfusion with 20 μm anisomycin. Bottom, Summary data of burst durations recorded at 90 min in bicuculline (3.923 ± 0.143 s) and 120 min after addition of anisomycin (3.688 ± 0.139 s) revealed no significant differences (p = 0.248, Student's t test for paired data; n = 4). Error bars indicate SEM, and n indicates the number of animals used.
Figure 5.
Figure 5.
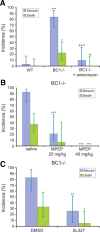
BC1 −/− animals are acutely susceptible to auditory stimuli. A, Lack of BC1 RNA significantly increased propensity for audiogenic seizures (exact logistic regression stratified by litter; ***p < 0.001, compared with WT). BC1 −/− animals also had a significantly higher audiogenic lethality incidence compared with WT (*p = 0.012). Injection of 75 mg/kg anisomycin intraperitoneally 1 h before onset of auditory stimuli prevented seizures (+++ p < 0.001) and death (+ p = 0.045) in BC1 −/− animals. WT, n = 30; BC1 −/−, n = 31; BC1 −/− injected with anisomycin, n = 20. B, Convulsive seizures and lethality were effectively prevented in BC1 −/− animals by intraperitoneal injection of MPEP at 40 mg/kg 30 min before onset of auditory stimuli. Compared with a saline-injected group, the 40 mg/kg MPEP group had a significant lower incidence of seizures (generalized linear model; p < 0.0001) and lethality (p < 0.0001). At 25 mg/kg MPEP, seizure incidence was significantly reduced (p = 0.0002). Saline control group, n = 29; 25 mg/kg MPEP group, n = 14; 40 mg/kg MPEP group, n = 10. C, Injection of selective MEK1/2 inhibitor SL327 (100 mg/kg in DMSO, i.p.) 60 min before auditory stimulation significantly reduced incidence of seizures (p < 0.01; exact logistic regression stratified by litter) and death (p < 0.05) in BC1 −/− animals (n = 18). Littermate control animals were injected with equal amounts of vehicle DMSO (n = 19). Error bars represent 95% confidence intervals (Cumming et al., 2007). n indicates the number of animals used.
Figure 6.
Figure 6.
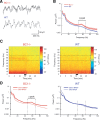
EEG recordings reveal increased mGluR-mediated gamma oscillations in BC1 −/− animals. A, Epidural EEG recordings from a BC1 −/− and a WT animal with recognizable theta and gamma oscillations. B, Average BC1 −/− (red line) and WT (blue line) power spectra, with pink and light blue shades indicating respective SEM. The BC1 −/− EEG had generally higher power, but the most salient difference was a prominent gamma peak centered at 57 Hz. BC1 −/− power was significantly higher between 47 and 67 Hz, the range centered on the gamma peak (t (13) = 2.2; p = 0.047). This range is illustrated by dashed lines. The differences between BC1 −/− and WT EEG in the delta, theta, or alpha–beta frequency bands did not reach statistical significance (p > 0.05 in each case). C, D, The mGluR5 antagonist MPEP was administered after 15 min of baseline recording. C, Spectrograms from single experiments with a BC1 −/− and a WT mouse illustrate that the main effect of MPEP was to decrease power in the BC1 −/− EEG in the range of the gamma peak. An effect of MPEP on the WT EEG was less apparent. The time of the administration is illustrated by the black bar. D, Treatment-averaged BC1 −/− and WT power spectra quantify the effect of MPEP on the EEG. Power in the range of the gamma peak was significantly reduced by MPEP in the BC1 −/− EEG (red thin line; t (4) = 3.08; p = 0.03) but did not change in the WT EEG (blue thin line; t (2) = 0.99; p = 0.43). Power in the theta (t (4) = 3.1; p = 0.04), alpha–beta (t (4) = 3.8; p = 0.02), and full gamma (t (4) = 3.1; p = 0.036) bands was also reduced in the BC1 −/− EEG. In contrast, in the WT EEG, MPEP increased theta power (t (2) = 4.3; p = 0.05) and did not change power in the alpha–beta (t (2) = 0.04; p = 0.97) or gamma (t (2) = 0.75; p = 0.52) bands. MPEP did not change delta power in BC1 −/− animals (t (4) = 0.7; p = 0.95) but increased power in the delta band of WT animals (t (2) = 11.3; p = 0.008).

Similar articles

Cited by

References

    1. Atkins CM, Selcher JC, Petraitis JJ, Trzaskos JM, Sweatt JD. The MAPK cascade is required for mammalian associative learning. Nat Neurosci. 1998;1:602–609. - PubMed
    1. Barciszewski J, Erdmann VA, editors. Georgetown, TX: Landes Bioscience; 2003. Noncoding RNAs: molecular biology and molecular medicine.
    1. Bassell GJ, Twiss JL. RNA exodus to Israel: RNA controlling function in the far reaches of the neuron. EMBO Rep. 2006;7:31–35. - PMC - PubMed
    1. Bear MF, Huber KM, Warren ST. The mGluR theory of fragile X mental retardation. Trends Neurosci. 2004;27:370–377. - PubMed
    1. Brosius J. Waste not, want not: transcript excess in multicellular eukaryotes. Trends Genet. 2005;21:287–288. - PubMed

Publication types

MeSH terms

LinkOut - more resources