. 2009 Aug 12;29(32):10010-24.
doi: 10.1523/JNEUROSCI.6183-08.2009.

Enigmatic central canal contacting cells: immature neurons in "standby mode"?

Affiliations

Enigmatic central canal contacting cells: immature neurons in "standby mode"?

Nicolás Marichal et al. J Neurosci. .

Abstract

The region that surrounds the central canal of the spinal cord derives from the neural tube and retains a substantial degree of plasticity. In turtles, this region is a neurogenic niche where newborn neurons coexist with precursors, a fact that may be related with the endogenous repair capabilities of low vertebrates. Immunohistochemical evidence suggests that the ependyma of the mammalian spinal cord may contain cells with similar properties, but their actual nature remains unsolved. Here, we combined immunohistochemistry for cell-specific markers with patch-clamp recordings to test the hypothesis that the ependyma of neonatal rats contains immature neurons similar to those in low vertebrates. We found that a subclass of cells expressed HuC/D neuronal proteins, doublecortin, and PSA-NCAM (polysialylated neural cell adhesion molecule) but did not express NeuN (anti-neuronal nuclei). These immature neurons displayed electrophysiological properties ranging from slow Ca(2+)-mediated responses to fast repetitive Na(+) spikes, suggesting different stages of maturation. These cells originated in the embryo, because we found colocalization of neuronal markers with 5-bromo-2'-deoxyuridine when injected during embryonic day 7-17 but not in postnatal day 0-5. Our findings represent the first evidence that the ependyma of the rat spinal cord contains cells with molecular and functional features similar to immature neurons in adult neurogenic niches. The fact that these cells retain the expression of molecules that participate in migration and neuronal differentiation raises the possibility that the ependyma of the rat spinal cord is a reservoir of immature neurons in "standby mode," which under some circumstances (e.g., injury) may complete their maturation to integrate spinal circuits.


Figures
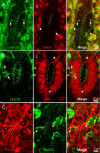
Figure 1.
Figure 1.
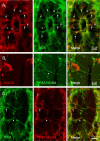
Immature neurons contacting the CC. A1–3, HuC/D+ cells (1, arrows) contacting the CC. No NeuN+ cells occurred within the ependymal layer (2). However, outside the ependyma all HuC/D+ cells had NeuN+ nuclei (3). The arrowheads in 2 and 3 point two HuC/D+ cells close to the ependymal layer with NeuN+ nuclei. B1–3, HuC/D+ cells (1, arrows) and Syto 64 labeled nuclei (2) in the ependyma of the rat. Notice that HuC/D + cells represent a minority of the cells within the ependymal layer (3) and that their nuclei (2, 3, open arrowheads) have a rounded shape that contrast with the elongated nuclei (2, 3, filled arrowheads) of most cells within the ependymal layer. C1–3, Most cells within the ependyma expressed the ependymal cell marker S100β (1). However, some S100β− cellular profiles (1, asterisks) within the ependymal layer expressed HuC/D (2–3, arrowheads). All images are single confocal optical planes. A, C, P2 rats; B, P5 rat.
Figure 2.
Figure 2.
HuC/D+ cells express proteins of neuroblasts in neurogenic niches. A1–3, HuC/D+ in the CC (1, arrows) had an apical process contacting the CC lumen (1, arrowhead). DCX expression (2) matched almost completely that of HuC/D (2 and 3, arrows). However, some HuC/D+ cells did not express DCX (1–3, empty arrowheads) whereas few DCX+ cells did not show HuC/D immunoreactivity (1–3, empty arrow). Single optical plane. B1–3, HuC/D+ cells (1) also expressed PSA-NCAM, (2, 3). Note the characteristic punctate pattern of PSA-NCAM expression on the surface of the cell (arrowhead in 2). Z-stack projection. C1–3, The majority of DCX+ cells (1, arrow) also expressed PSA-NCAM (2 and 3). Notice the conspicuous apical processes reaching the CC lumen (arrowheads). Single confocal optical plane. A, B, P2 rat; C, P5 rat.
Figure 3.
Figure 3.
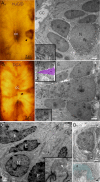
Fine structure characteristics of immature neurons within the ependymal layer. A1, 2, Light microscope image of a HuC/D+ cell (1, arrowhead) resin-epoxy embedded. The same cell is shown under the electron microscope in 2. The osmium-DAB precipitates (2, inset) allowed to identify the limits of the cell which are outlined by a dotted line. Notice the round nucleus of the HuC/D+ cell which is lighter than the elongated nuclei of neighboring ependymal cells (2, E). B1, 2, Light microscope image of a DCX+ cell in the ependymal layer (1, arrowhead). Conspicuous osmium-DAB precipitates allowed the identification of the DCX+ cell at the TEM level (2, lower left inset). As for HuC/D+ cells, the nucleus of the DCX+ cell had a round appearance (2, N) compared with neighboring nuclei (2, E). The apical process was easily identified and contacted the CC lumen (2, upper left inset; shadowed). C, Low power electronmicrograph of a putative immature neuron (N) in better preserved tissue that was not exposed to detergents. Note the round shaped nucleus that contrasts with the elongated nuclei of adjacent cells (E). An apical process reaches the CC lumen. The inset shows a tangential view of a cilium (arrow) surrounded by a crown of slender microvilli. D1, 2, Another putative immature CC-contacting neuron with an electron dense cytoplasm containing abundant free ribosomes. Notice the process arising from the basal pole (1, asterisk). This poorly differentiated process (2, shaded in light blue) showed no evidences of either neurotubes or neurofilaments. A, B, P4 rat; C, P2 rat; D, P4 rat.
Figure 4.
Figure 4.
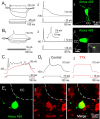
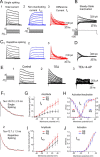
Functional phenotypes of CC-contacting cells: passive responses versus Ca2+ electrogenesis. A1–3, Responses of a CC-contacting cell to a series of current steps (1). Current-voltage (C/V, 2) relationship of the cell shown in 1. Notice the passive responses to depolarizing current pulses and the linear behavior in the C/V plot. The excitation of Alexa 488 revealed that the cell recorded in 1 appeared dye coupled with neighboring cells (3). Conventional epifluorescence and DIC in a living slice. B1–4, Active response properties in a CC-contacting cell. A depolarizing current pulse produced a slow potential (1, arrowhead). Notice the presence of spontaneous synaptic activity (1, arrows). The slow potential could be generated in an all-or-non manner by a short-lasting current pulse (2) or by a barrage of spontaneous synaptic potentials (3, arrow). As revealed by injection of Alexa 488, the cell recorded in 2 had a single short process contacting the CC (4, arrow; conventional epifluorescence). C1, 2, Slow depolarizing potential in a CC-contacting cell (1). A small and brief transient appeared at the beginning of the active response (1, arrow). The slow response was not sensitive to 1 μm TTX but the brief transient disappeared, indicating a small contribution of Na+ channels (2). Addition of 3 mm Mn2+ completely blocked the slow depolarizing potential (2), indicating the involvement of Ca2+ channels. D1, 2, Slow spike in response to a transient hyperpolarization (1). The slow response had a threshold close to –50 mV. The low threshold response was not blocked by TTX (1 μm) but was abolished by 300 μm Ni2+ (2). A, P3 rat; B, P2 rat; C, P4 rat; D, P1 rat.
Figure 5.
Figure 5.
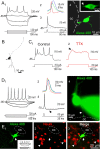
Single spiking CC-contacting cells. A1–3, Response of a cell in the ependyma to a series of current pulses. A 500 ms depolarizing current pulse applied at the resting membrane potential produced a small single fast spike followed by damped oscillations of the membrane potential (1). In this cell, a brief depolarizing current pulse applied at hyperpolarized membrane potentials produced a fast single spike followed by a slow depolarizing potential (2). Confocal image of the cell shown in 1 and 2 (3). Notice the cell body connected to the CC by a single process and several short neurites arising from the basal pole. B1–3, Single spiking cell (1) with an action potential that had a repolarizing phase without depolarizing afterpotential (2). This cell had a small cell body that contacted directly the CC lumen and very short processes (3). C, Response to the same depolarizing current pulse applied at two levels of hyperpolarizing bias current. The delayed depolarization when the cell was stimulated from hyperpolarizing potentials resulted in the blockade of action potential generation (red). D1, 2, The action potential (1) was blocked by 1 μm TTX (2). E1–3, A biocytin-filled single spiking cell (1) expressed HuC/D (2, 3). All images are Z-stack projections. A, P2 rat; B, P1 rat; C, P4 rat; D, P1 rat; E, P3 rat.
Figure 6.
Figure 6.
Repetitive spiking CC-contacting cells. A1–4, Responses to a series of current pulses of a cell that fired repetitively (1). Notice the occurrence of spontaneous synaptic events. The first (red), second (green) and third (blue) action potentials during the spike train are shown superimposed in 2. Notice the increase in threshold and half-amplitude duration during the spike train. The action potential produced by a brief current pulse lacks a slow after-hyperpolarization (3). Confocal Z-stack projection (4) of the cell recorded in 1. The single process attached to the CC had an endfoot (4, encircled) with a single thin cilium-like process (4, arrow in inset). B, Camera lucida drawing of the cell recorded in A. Notice the presence of long (>30 μm) branching neurites arising from the cell body. C1, 2, The fast action potentials (1) in repetitive spiking cells were blocked by TTX (1 μm, 2). However, a slow depolarizing potential remained in the presence of TTX (2, arrow). D1–4, CC-contacting cell with a more robust repetitive spiking (1) than that shown in A. The first (red), second (green) and third (blue) action potentials are shown superimposed in 2. Notice the minor changes in spike amplitude, duration and threshold. The action potential in this cell had a well developed sAHP (3, arrow). The image in 4 (conventional epifluorescence) shows that this cell was still connected to the CC via a thin single process (arrow), whereas a conspicuous branching neurite originated from the basal pole. E1–3, A biocytin-filled cell (1, arrow) with a repetitive spiking phenotype (1, inset; calibration: 20 mV, 10 pA and 100 ms) connected to the CC by a single process and with well developed neurites. Immunocytochemistry for NeuN showed several reactive nuclei (2, arrowheads). The merged images (3) show that the recorded cell did not express NeuN (2, 3, arrow). Confocal optical plane. A–C, P3 rats; D, P5 rat; E, P2 rat.
Figure 7.
Figure 7.
Na+ current (INa) in single and repetitive spiking cells. A, Leak subtracted currents in single (1) and repetitive (2) spiking cells in response to depolarizing voltage steps applied from a holding potential of −70 mV. As expected the inward currents were blocked by 1 μm TTX (traces in upper right corner). B, Peak INa density at different membrane potentials in single (red) and repetitive (black) spiking cells. A 1, P3 rat; A 2, P5 rat; B, P1–P5 rats.
Figure 8.
Figure 8.
K+ currents in single and repetitive spiking cells. A1–3, Outward currents evoked in a single spiking cell during 100 ms depolarizing voltage steps after a 75 ms prepulse to −90 mV (1). The currents evoked with the same protocol as in 1 but after a prepulse to −30 mV have a slow onset with no inactivation (2), suggesting a delayed rectifier (I KD). The difference between the currents obtained with the protocols in 1 and 2 revealed a current with fast onset and strong time dependent inactivation (3) typical of A-type currents (I A). B, Steady state inactivation protocol shows the voltage dependence of I A inactivation. C, D, Same protocols as in A and B, but in a repetitive spiking cell. E1–3, Pharmacological separation of outward currents. TEA (10 mm) blocked the sustained component of the total outward current (1, 2), whereas 2 mm 4-AP blocked the transient K+ current (3). F1, 2, Time course of I A inactivation for single (1) and repetitive (2) spiking cells. The currents were obtained at +30 mV after a prepulse to −100 mV. The inactivation process was fitted to a single exponential function. G, Peak I A density as a function of the membrane potential for single (red, SS) and repetitive (black, RS) spiking cells. H, Activation and inactivation curves for I A in single (red, SS) and repetitive (blue, RS) spiking cells. I, Peak IKD density as a function of the membrane potential for single (red, SS) and repetitive (black, RS) spiking cells. J, Activation curves for I KD in single (red, SS) and repetitive (blue, RS) spiking cells. A, B, P4 rat; C, D, P1 rat; E, P3 rat; F, P1–P5 rats; G–J, data pooled from P1 to P3 rats for SS, and P2 and P3 rats for RS.
Figure 9.
Figure 9.
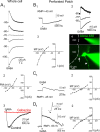
GABA-induced responses in CC-contacting immature neurons. A1–3, Responses of a CC-contacting cell to puff application (10 ms) of GABA (100 μm) at different membrane potentials (1). In conventional whole-cell recordings the GABA-induced current reversed at the expected Cl equilibrium potential imposed by the internal solution (2). GABAA receptors mediated the GABA-induced current because gabazine (10 μm) blocked the response (3). B, D: GABA-induced responses recorded with the gramicidin perforated-patch technique. B1–4, In some cells, GABA application in current-clamp mode induced a strong hyperpolarizing response from rest (1). The GABA-induced currents (2) of this cell reversed at −62 mV (3). The images in 4 show the recording conditions in perforated patch mode and after rupturing the patch. Confirmation of perforated patch is evidenced by the lack of diffusion of Alexa 488 into the cell (upper image). After completion of the experiment, the membrane was ruptured and the dye diffused rapidly into the cell (lower image). Notice the apical process in contact with the CC lumen (4, arrow) and the well developed neurite arising from the cell body (4, arrowhead). Conventional epifluorescence. C1, 2, Depolarizing response induced by GABA application (1). The GABA-induced current in this CC-contacting cell reversed at −45 mV (2). D1, 2, Strong GABA-induced depolarization provoked spike firing in a single spiking CC-contacting cell (1). The inset shows the initial depolarization that generated the action potential. The GABA-induced current in this cell reversed at – 43 mV (2). A, P5 rat; B, P1 rat; C, P2 rat; D, P5 rat.
Figure 10.
Figure 10.
CC-contacting immature neurons in older rats. A1–3, Response properties of a CC-contacting cell in a P17 rat (1). Notice the generation of a single spike in response to a long lasting depolarization. A brief depolarizing current pulse applied from hyperpolarized membrane potential evoked a small, brief spike followed by a slow depolarizing potential (2). Intracellular injection of Alexa 488 showed a morphology similar to that observed in neonatal animals with a single process contacting the CC (3, arrow). Confocal Z-stack projection. B, Immunocytochemistry for NeuN shows many positive cells in a P21 rat. However, even at this age the ependyma was devoid of NeuN+ nuclei. C, PSA-NCAM+ cells appeared in a P40 rat. B, C, Confocal single optical planes.
Figure 11.
Figure 11.
Acid and ATP mediated responses in CC-contacting immature neurons. A1–4, Single spike evoked in a CC-contacting cell by a 500 ms depolarizing current pulse (1). The cell was strongly excited by a brief application of a Ringer's solution buffered at pH 6 (2). Currents induced by different puff durations in the same cell (3). Notice that even a 100 ms puff induced almost maximal currents (3, red trace). Increasing the duration to 200 ms slightly increased the peak current and prolonged the response (3, green trace). Further increases in puff duration did not change acid induced currents (blue trace). Injection of Alexa 488 confirmed the cell contacted the CC (4). B1–4, Repetitive spiking of a cell in the ventral horn in response to a depolarizing current pulse (1). A brief puff of an acidic Ringer's solution produced a strong excitation, with robust repetitive spike firing (2). The acid-induced currents were maximally activated even by a 100 ms puff (3). The image in 4 shows the morphology and the location (inset) of the ventral horn neuron. C1–4, Repetitive spiking CC-contacting cell (1, inset, calibration: 20 mV, 10 pA and 100 ms) was strongly excited by brief application of ATP (100 μm, 2). The ATP-induced inward current showed a strong rectification, becoming almost undetectable at a holding membrane potential of −20 mV (3, 4). A, P2 rat; B, P4 rat; C, P3 rat. All images are from conventional epifluorescence.
Figure 12.
Figure 12.
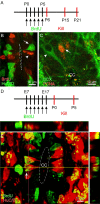
Birth date of CC-contacting neurons. A, BrdU protocol to test the generation of CC-contacting neuroblasts in the early postnatal life. B, Double-labeling for HuC/D and BrdU at P15. Although many ependymal cells proliferated in neonatal rats (arrowhead) none of them colocalized the early neuronal marker HuC/D (arrow). Confocal Z-stack projection. C, Some ependymal cells were positive for the cell cycle marker PCNA (arrow) but they did not colocalize with DCX (arrowhead). Single confocal optical plane. D, BrdU protocol to test the generation of CC-contacting neuroblasts in the embryo. E, In newborn rats injected between E7–E17 and killed at P0–P5 some HuC/D+ cells showed BrdU+ nuclei (arrow in main panel and orthogonal images). Confocal Z-stack projection. C, E, P2 rat.

Similar articles

Cited by

References

    1. Alonso G. Neuronal progenitor-like cells expressing polysialylated neural cell adhesion molecule are present on the ventricular surface of the adult rat brain and spinal cord. J Comp Neurol. 1999;414:149–166. - PubMed
    1. Baron A, Voilley N, Lazdunski M, Lingueglia E. Acid sensing ion channels in dorsal spinal cord neurons. J Neurosci. 2008;28:1498–1508. - PMC - PubMed
    1. Barry PH, Diamond JM. Junction potentials, electrode standard potentials, and other problems in interpreting electrical properties in membranes. J Membr Biol. 1970;3:93–122. - PubMed
    1. Beattie MS, Bresnahan JC, Komon J, Tovar CA, Van Meter M, Anderson DK, Faden AI, Hsu CY, Noble LJ, Salzman S, Young W. Endogenous repair after spinal cord contusion injuries in the rat. Exp Neurol. 1997;148:453–463. - PubMed
    1. Belluzzi O, Benedusi M, Ackman J, LoTurco JJ. Electrophysiological differentiation of new neurons in the olfactory bulb. J Neurosci. 2003;23:10411–10418. - PMC - PubMed

Publication types

MeSH terms