. 2009 Aug 12;29(32):10047-62.
doi: 10.1523/JNEUROSCI.0822-09.2009.

Endothelin-1 regulates oligodendrocyte development

Affiliations

Endothelin-1 regulates oligodendrocyte development

Ana Gadea et al. J Neurosci. .

Abstract

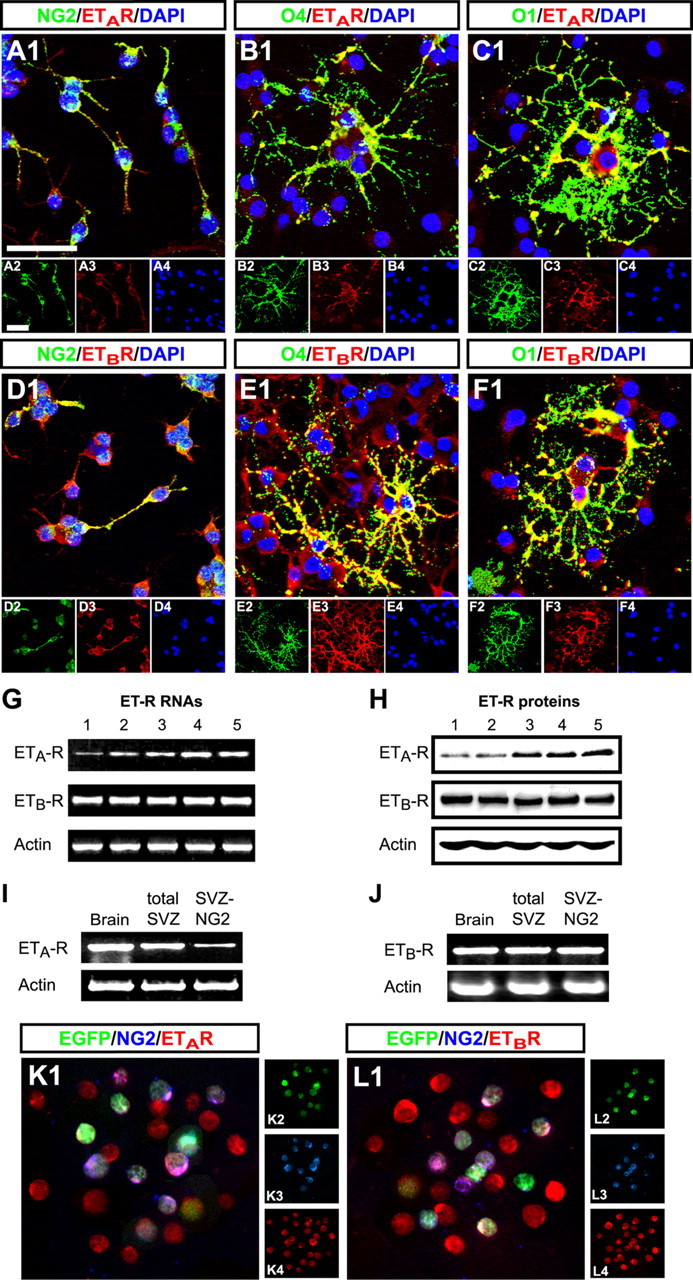
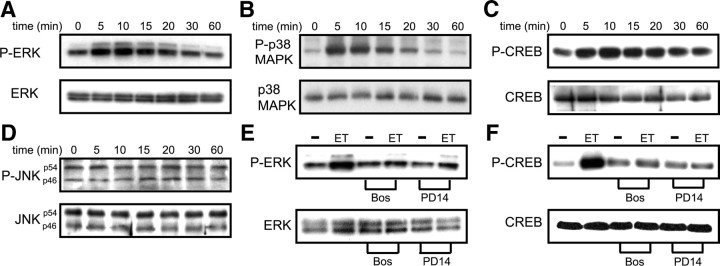
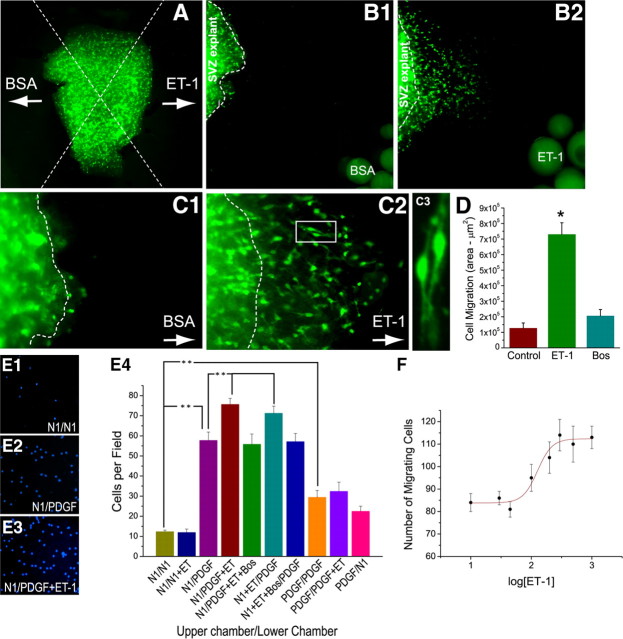
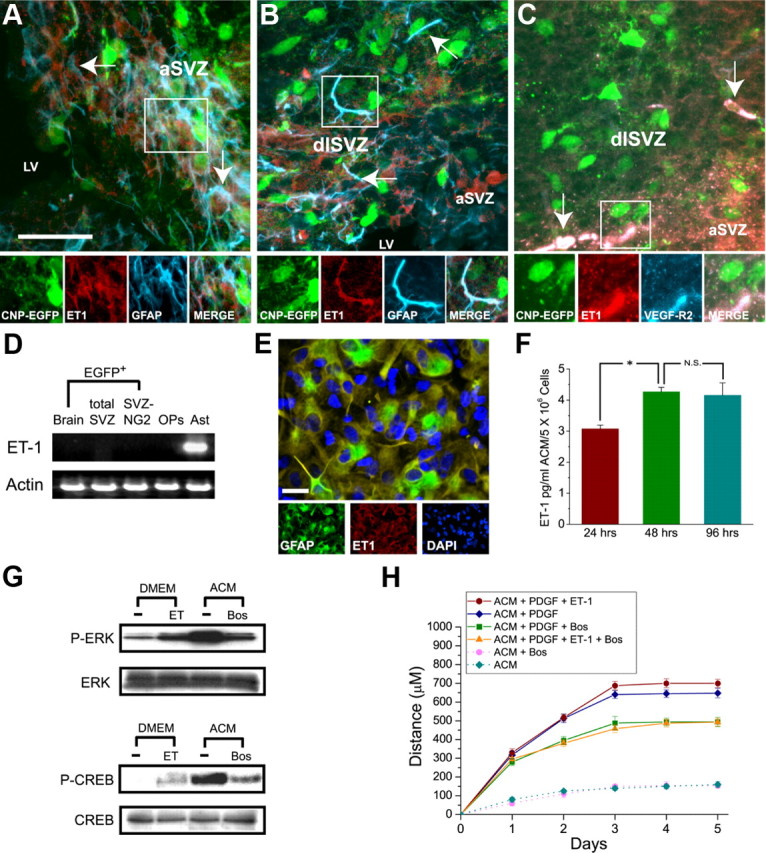
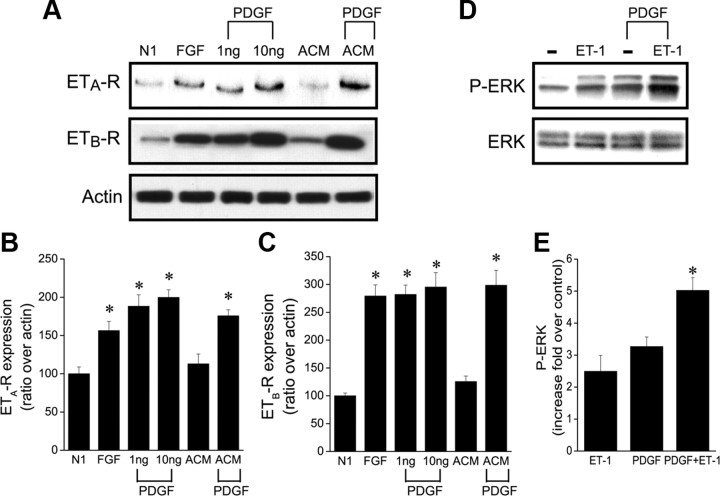
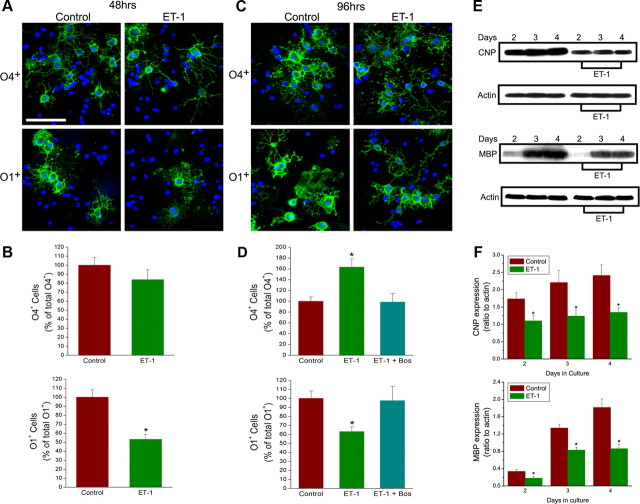
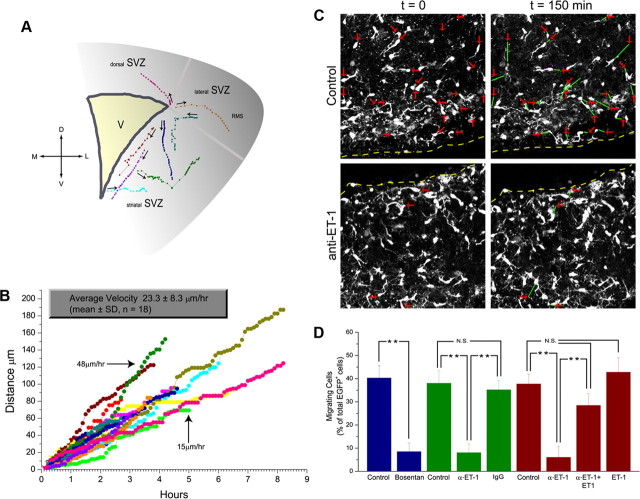
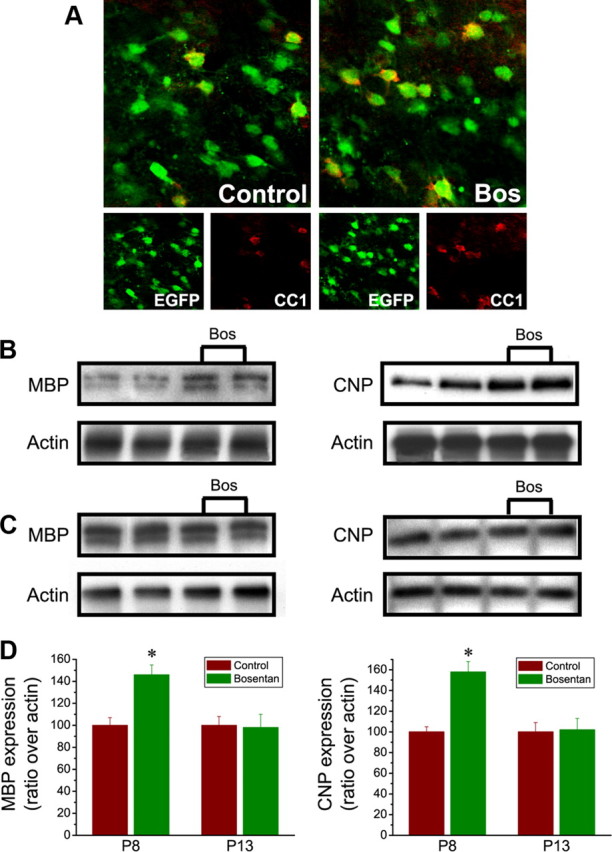
In the postnatal brain, oligodendrocyte progenitor cells (OPCs) arise from the subventricular zone (SVZ) and migrate into the developing white matter, where they differentiate into oligodendrocytes and myelinate axons. The mechanisms regulating OPC migration and differentiation are not fully defined. The present study demonstrates that endothelin-1 (ET-1) is an astrocyte-derived signal that regulates OPC migration and differentiation. OPCs in vivo and in culture express functional ET(A) and ET(B) receptors, which mediate ET-1-induced ERK (extracellular signal-regulated kinase) and CREB (cAMP response element-binding protein) phosphorylation. ET-1 exerts both chemotactic and chemokinetic effects on OPCs to enhance cell migration; it also prevents lineage progression from the O4(+) to the O1(+) stage without affecting cell proliferation. Astrocyte-conditioned medium stimulates OPC migration in culture through ET receptor activation, whereas multiphoton time-lapse imaging shows that selective ET receptor antagonists or anti-ET-1 antibodies inhibit OPC migration from the SVZ. Inhibition of ET receptor activity also derepresses OPC differentiation in the corpus callosum in slice cultures. Our findings indicate that ET-1 is a soluble astrocyte-derived signal that regulates OPC migration and differentiation during development.


Figures

Figure 1.
Figure 1.
ET-Rs are expressed in cells of oligodendrocyte lineage in culture and in vivo and in progenitors of the subventricular zone. A–F, Immunostaining was performed in cells of oligodendrocyte lineage in culture: 57% of cells were NG2+, 52% O4+, and 26% O1+. Double immunostaining used the above-mentioned cell surface antibodies (green) and anti-ET-R antibodies (red). Nuclear staining used DAPI (blue). The smaller panels show individual channels. Both receptors are expressed in NG2+, O4+, and O1+ cells. Scale bars, 30 μm. G, RT-PCR analysis of ET-Rs mRNA expression in cultured oligodendrocyte lineage cells. Total RNA was extracted from OPCs at 1–5 d in culture. ETA-R mRNA showed time-dependent increase in culture; ETB-R mRNA levels remained constant. H, Cell lysates from cultured OPCs were analyzed by Western blot at 1–5 d in culture. Expression levels of both ET-R proteins match those of their mRNAs. I, J, ET-R mRNA expression in EGFP+ cells FACS-purified from CNP-EGFP transgenic mouse brain. Total RNA was obtained from EGFP+ cells of total brain (GFP) and SVZ. Double sorting from SVZ used an antibody against the NG2 proteoglycan, obtaining a pure population of NG2-expressing EGFP+ progenitors (NG2). Total mRNA was reverse transcribed to cDNA and analyzed by PCR. mRNA for both receptors was expressed in brain EGFP+ oligodendrocyte lineage cells, in SVZ OPCs, and in NG2-expressing progenitors of SVZ. Note: In NG2-expressing progenitors ETA-R shows lower mRNA expression than ETB-R. K, L, Immunostaining in dissociated cells from the SVZ of P8 CNP-EGFP mice. Two hours after plating, cells were immunostained with antibodies against NG2 and the ETA (K) or the ETB (L) receptors. Ninety-eight percent of NG2+EGFP+ (green) cells in the SVZ displayed immunostaining for both ET-Rs (red).
Figure 2.
Figure 2.
ET-1 activates ET-Rs to induce ERK, p38MAPK, and CREB phosphorylation. A, Time course of ET-1-induced ERK phosphorylation in OPCs. Cultured OPCs were stimulated with 100 nm ET-1 for times indicated; total cell lysates were analyzed by Western blot using anti-P-ERK or antibody for total ERK. B, Time course of ET-1-induced p38MAPK phosphorylation. OPCs were stimulated as in A. Lysates were analyzed using anti-P-p38MAPK antibody or antibody for total p38MAPK. C, Time course of ET-1-induced CREB phosphorylation. OPCs were stimulated as in A. Lysates were analyzed using anti-P-CREB antibody or antibody for total CREB. D, ET-1 does not induce JNK phosphorylation. OPCs were stimulated as in A. Lysates were analyzed using anti-P-JNK antibody or antibody for total JNK. E, Effects of ET-R antagonists on ET-1-induced ERK phosphorylation. OPCs were preincubated for 15 min with ET-R pan-antagonists bosentan (Bos) (2 μm) or PD142893 (PD14) (2 μm). After preincubation, cells were stimulated with 100 nm ET-1 for 10 min. Lysates were analyzed using anti-P-ERK antibody or antibody for total ERK. F, OPCs were treated with ET-R antagonists and stimulated as in E. Lysates were analyzed using anti-P-CREB antibody or total CREB antibody. For all blots A–F, similar results were obtained in three independent experiments; representative Western blots are shown.
Figure 3.
Figure 3.
ET-1 stimulates OPC migration. Agarose drop assays were used to measure ET-1 (200 nm) effects on OPC migration. A, ET-1 stimulates OPC migration in the presence of PDGF, compared with PDGF alone (*significantly different from control at corresponding time points; Student's t test; **p < 0.01). ET-R pan-antagonist bosentan (2 μm) completely prevented ET-1 effects on OPC migration (PDGF/PDGF + ET-1 + Bos vs PDGF/PDGF + ET-1, significantly different at days 4, 5, and 6; p < 0.01). B, Cell density at different distances from the edge of the drop (expressed as number of cells per unit area) in assays performed for 6 d in the absence (Sato medium) or presence of PDGF (10 ng/ml) and/or ET-1 (200 nm). At 6 d in the presence of PDGF, ET-1 significantly increased the number of cells migrating out of the agarose drop (Student's t test, p < 0.05). Data are means ± SEM of two independent experiments performed in triplicate. C, D, Staining of the agarose drop assay after 48 h with A2B5 (green) and anti-Olig2 antibodies (red) and counterstained with DAPI (blue). Most cells were A2B5+ and Olig2+, and remaining cells were O4+ (data not shown). ET-1 stimulated cell migration out of the drop without changing relative proportion of A2B5+ or Olig2+ cells (>95% A2B5+/Olig2+ cells under both conditions). E, Effects of ETA-R antagonist JKC-301 (1 μm) and ETB-R antagonist IRL-1038 (1 μm) on OPC migration were determined in the presence of ET-1 (200 nm) and PDGF (10 ng/ml). ET-1 stimulated OPC migration in the presence of PDGF, compared with control (PDGF alone). At 6 d, ETA-R and ETB-R antagonists JKC-301 and IRL-1038 (1 μm) significantly inhibited ET-1-stimulated migration (34 ± 5 and 75 ± 4%, respectively; Student's t test, *p < 0.05, **p < 0.01). F, ETA-R and ETB-R antagonists JKC-301 and IRL-1038 (both 1 μm) inhibited effects of ET-1 on P-ERK phosphorylation. Student's t test, **p < 0.01. Equal loading in Western blot was demonstrated by detection of total ERK.
Figure 4.
Figure 4.
ET-1 is a chemotaxic and chemokinetic signal for OPCs. SVZ explants from CNP-EGFP mice were cocultured with BSA-soaked (B1) and ET-1-soaked (B2) heparin beads. EGFP+ cells preferentially migrate toward ET-1 (B2) compared with BSA beads (B1). The arrows in A, C1, and C2 point to the position of the soaked bead. The dotted lines indicate edges of SVZ explants. Higher magnification images are shown in C1 and C2. C3, Image from boxed area in C2. Migratory cells with ET-1 (B2, C2, C3) displayed bipolar morphology distinct from nonmigratory cells with BSA (B1, C1). D, Quantification of cell migration. Histogram illustrates quantification of cell migration in SVZ explants, shown as average ± SEM of migration area (in square micrometers). Nine explants from three different experiments were analyzed. *p < 0.01. E, F, Cell migration was studied using microchemotaxis chambers (Boyden chambers). E1–E3, Representative images of rat OPCs that migrated through the filters under conditions shown, assessed by nuclear staining with DAPI. ET-1 promotes migration in the presence of PDGF, compared with PDGF alone. E4, Quantification of cell migration. Different combinations of PDGF and ET-1 were used in lower and upper chambers to measure migration. Unpaired t test compared with N1/N1, *p < 0.05, **p < 0.01. F, Dose–response curve showing effect of ET-1 on OPC migration, with maximal effect of ET-1 at 200 nm. Data represent averages ± SEM of quadruplicate determinations from three different experiments.
Figure 5.
Figure 5.
Astrocytes synthesize and release ET-1 that can activate ET-Rs in OPCs. A–C, Astrocytes and endothelial cells of SVZ synthesize ET-1 in situ. Double immunostaining of coronal brain slices from CNP-EGFP mice with anti-ET-1, and anti-GFAP or anti-VEGF-R2 antibodies: ET-1 immunoreactivity is present in astrocytes of aSVZ and dlSVZ (A, B) and endothelial cells of aSVZ (C). The arrows point at examples of cells immunopositive for ET-1. D, RT-PCR analysis for ET-1 mRNAs shows cultured astrocytes (Ast) express ET-1 mRNA. No ET-1 mRNA was detected in total brain EGFP+ cells, SVZ EGFP+ cells, or double-sorted NG2+/EGFP+ SVZ cells FACS-purified from CNP-EGFP transgenic mice. ET-1 mRNA was absent from cultured OPs (2 d culture). E, ET-1 is expressed in cultured astrocytes. Anti-ET-1 staining (red) demonstrates expression in GFAP+ (green) astrocytes. Cell nuclei were stained with DAPI (blue). Scale bar, 30 μm. F, ACM contains ET-1. ET-1 concentrations were measured by enzyme immunometric assays at different times in culture. ET-1 concentration increased between 24 and 48 h, but no further after 48 h (*p < 0.05; N.S., not significant). Data are the mean ± SEM of duplicate measurements from five independent cultures. G, ET-1 in ACM can activate ET-Rs in cultured OPCs. OPCs were stimulated for 10 min with ET-1 (100 nm) or ACM, in the presence or absence of ET-R pan-antagonist bosentan (Bos) (2 μm). Total cell lysates were analyzed by Western blot using anti-P-ERK or anti-P-CREB antibodies. H, ET-1 present in ACM stimulates OPC migration. Cell migration was quantified as described for Figure 3, except ACM replaced Sato medium. With PDGF, ACM effect on OPC migration resembled that of ET-1 (Fig. 3). Bosentan, with or without ET-1, inhibited ACM effects on OPC migration in the presence of PDGF (ACM + PDGF + Bos vs ACM + PDGF; significant differences were observed between days 2 and 5, Student's t test, *p < 0.05).
Figure 6.
Figure 6.
ET-R expression is regulated by growth factors. A, ETA-R and ETB-R expression is increased by growth factors. Cultured OPCs were grown in the N1 medium alone or in the presence of 10 ng/ml bFGF, 1 ng/ml or 10 ng/ml PDGF; or in astrocyte-conditioned medium with or without 10 ng/ml PDGF. Cell lysates were prepared after 2 DIV and were analyzed by Western blot using anti-ETA-R antibody or anti-ETB-R antibody. B, C, Densitometric analysis demonstrated a peak twofold increase of ETA-R with 10 ng/ml PDGF, and a threefold increase for ETB-R in the same condition. Data were normalized to actin. D, Cultured OPCs were stimulated with 100 nm ET-1 and/or 10 ng/ml PDGF for 15 min; total cell lysates were analyzed by Western blot using anti-P-ERK or antibody for total ERK. E, Similar results were obtained in three independent experiments; representative Western blots are shown; averages ± SEM from three to four independent samples are shown. *Significantly different from control (Student's t test, p < 0.01).
Figure 7.
Figure 7.
ET-1 delays OPC differentiation. A–D, ET-1 delays oligodendrocyte lineage progression, preventing O4–O1 transition. Differentiation was assessed by immunostaining with antibodies against O4 and O1 (green), at 48 h (A, B) or 96 h (C, D) after plating. Cells were counterstained with DAPI (blue). The ratio of O4+ or O1+ (B, D) cells/DAPI+ nuclei was calculated in each field. B, ET-1 decreased the percentage of O1+ cells to 55 ± 5% of controls after 48 h. No significant change occurred in percentage of O4+ cells. D, At 96 h, ET-1 induced an increase in the percentage of O4+ cells (145 ± 15% of control) and a decrease in O1+ cells (63 ± 5% of control). Percentages of O4+ and O1+ cells in controls were 35 ± 4 and 15 ± 3 at 48 h; 25 ± 4 and 46 ± 5 at 96 h, respectively. O1+ cells treated with ET-1 are less branched, compared with O1+ cells in control conditions at 96 h (C, bottom panels). D, ET-1 effects on oligodendrocyte lineage progression were prevented by ET-R pan-antagonist bosentan (1 μm). Data are expressed as mean percentage ± SEM of four independent experiments performed in triplicate. *Significantly different from control (Student's t test, p < 0.05). Scale bar: A, C, 50 μm. E, ET-1 inhibits expression of myelin-related proteins in OPCs differentiating in culture. Western blot analysis of CNP and MBP expression. Cells were collected for protein extraction for CNP and MBP expression analysis at times indicated. Total cell lysates were analyzed by Western blot using monoclonal antibodies against CNP or MBP, with β-actin for loading control. F, Densitometric analysis demonstrated that ET-1 inhibited CNP and MBP expression. Data were normalized to actin; averages + SEM from three to four independent samples are shown. *Significantly different from control (Student's t test, p < 0.01). Results indicate that ET-1 induces a less differentiated phenotype in oligodendrocytes.
Figure 8.
Figure 8.
Endogenous ET sustains OPC migration in situ. A, B, Baseline migration of OPCs in SVZ, determined by time-lapse microscopy. A, Reconstruction of migratory paths of EGFP+ cells observed over 4 h. Each point represents the cell body position of individual cells recorded at 6 min intervals. The intersegmental distance represents the relative velocity of the cell at that moment. The arrows indicate direction of initial movement. B, Migration rates of 18 selected migrating progenitor cells in control experiments. Each color represents an individual cell. Note that cells migrated in a saltatory manner. C, Effects of anti-ET-1 antibodies on OPC migration. Still images of EGFP+ cells are shown from time-lapse confocal microscopy. The red arrows indicate starting positions of migrating cells; the green lines represent distance migrated after 2 h. Progenitors were bipolar with leading and trailing processes. In slices treated with anti-ET-1, the number of migrating cells was reduced, indicating that ET-R activation by endogenous ET-1 is required for OPCs in SVZ in situ. D, Average percentage of migrating cells under different culture conditions. Percentage of migrating cells was calculated relative to total number of EGFP+ cells in the imaged field. Bosentan (1 μm) and anti-ET-1 (1:500) significantly reduced the percentage of cells migrating in the SVZ (**p < 0.01). Control anti-IgG antibody had no effect (N.S., not significant). Effects of anti-ET-1 were reversed by 50 nm ET-1, but ET-1 (50 nm) alone did not modify overall number or velocity of migrating cells. Data are the mean ± SEM of three independent experiments. The number of cells analyzed was 40–200.
Figure 9.
Figure 9.
Endogenous endothelin modulates OPC differentiation in situ. Organotypic slice cultures from P8 (A, B) or P13 (C) CNP-EGFP mice were cultured for 4 d in the presence or absence of bosentan (1 μm). A, Confocal images show colabeling of CNP-EGFP with antibodies to CC1 in subcortical white matter. Scale bar, 50 μm. Total protein extracts from each corpus callosum were analyzed by Western blot using monoclonal antibodies against MBP (B, C, left panels) or CNP (B, C, right panels). Duplicate samples from separate organotypic cultures are shown for each age and culture condition. P8 cultures treated with bosentan, but not P13 slices, show higher levels of MBP and CNP expression. β-Actin (bottom panels) demonstrates equal loading of protein samples. MBP and CNP expression levels were normalized with actin to compare bosentan-treated with control samples. D, Densitometric analysis demonstrates that bosentan increased CNP and MBP expression in P8 slices, but not P13 brains. Results are expressed in arbitrary units as averages + SEM from four independent experiments performed in duplicate. *p < 0.01, Student's t test.

Similar articles

Cited by

References

    1. Aguirre A, Gallo V. Postnatal neurogenesis and gliogenesis in the olfactory bulb from NG2-expressing progenitors of the subventricular zone. J Neurosci. 2004;24:10530–10541. - PMC - PubMed
    1. Aguirre A, Rizvi TA, Ratner N, Gallo V. Overexpression of the epidermal growth factor receptor confers migratory properties to nonmigratory postnatal neural progenitors. J Neurosci. 2005;25:11092–11106. - PMC - PubMed
    1. Aguirre A, Dupree JL, Mangin JM, Gallo V. A functional role for EGFR signaling in myelination and remyelination. Nat Neurosci. 2007;10:990–1002. - PubMed
    1. Aguirre AA, Chittajallu R, Belachew S, Gallo V. NG2-expressing cells in the subventricular zone are type C-like cells and contribute to interneuron generation in the postnatal hippocampus. J Cell Biol. 2004;165:575–589. - PMC - PubMed
    1. Armstrong RC, Harvath L, Dubois-Dalcq ME. Type 1 astrocytes and oligodendrocyte-type 2 astrocyte glial progenitors migrate toward distinct molecules. J Neurosci Res. 1990;27:400–407. - PubMed

Publication types

MeSH terms

Substances