. 2009 Oct;102(4):2358-74.
doi: 10.1152/jn.91346.2008. Epub 2009 Aug 12.

Coding of repetitive transients by auditory cortex on Heschl's gyrus

Affiliations

Coding of repetitive transients by auditory cortex on Heschl's gyrus

John F Brugge et al. J Neurophysiol. 2009 Oct.

Abstract

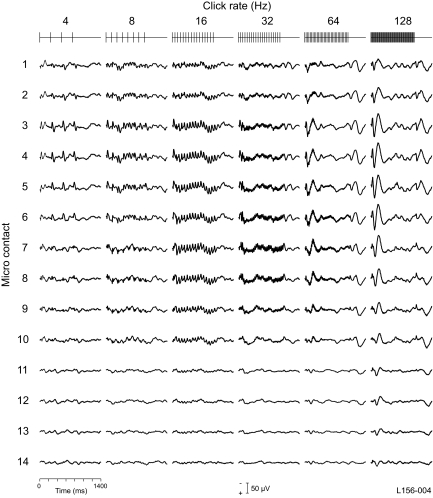
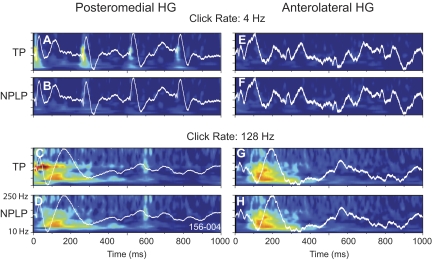
The capacity of auditory cortex on Heschl's gyrus (HG) to encode repetitive transients was studied in human patients undergoing surgical evaluation for medically intractable epilepsy. Multicontact depth electrodes were chronically implanted in gray matter of HG. Bilaterally presented stimuli were click trains varying in rate from 4 to 200 Hz. Averaged evoked potentials (AEPs) and event-related band power (ERBP), computed from responses at each of 14 recording sites, identified two auditory fields. A core field, which occupies posteromedial HG, was characterized by a robust polyphasic AEP on which could be superimposed a frequency following response (FFR). The FFR was prominent at click rates below approximately 50 Hz, decreased rapidly as click rate was increased, but could reliably be detected at click rates as high as 200 Hz. These data are strikingly similar to those obtained by others in the monkey under essentially the same stimulus conditions, indicating that mechanisms underlying temporal processing in the auditory core may be highly conserved across primate species. ERBP, which reflects increases or decreases of both phase-locked and non-phase-locked power within given frequency bands, showed stimulus-related increases in gamma band frequencies as high as 250 Hz. The AEPs recorded in a belt field anterolateral to the core were typically of low amplitude, showing little or no evidence of short-latency waves or an FFR, even at the lowest click rates used. The non-phase-locked component of the response extracted from the ERBP showed a robust, long-latency response occurring here in response to the highest click rates in the series.


Figures

Fig. 1.
Fig. 1.
Left: MRI of the superior temporal plane showing the trajectory of the hybrid depth electrode (HDE) with respect to gross anatomical landmarks: PP, planum polare; PT, planum temporale; HG, Heschl's gyrus; TG2, secondary transverse gyrus; hs, Heschl's sulcus; ats, anterior temporal sulcus. Recording sites, designated by filled circles, are shown projected on the cortical surface. The asterisk and cross mark recording sites, similarly designated on Fig. 2, are within what is interpreted to be the auditory core and belt, respectively. Right: cross-sections of the superior temporal plane at the 3 recording locations roughly perpendicular to the long axis of HG (dashed lines on the MRI). Light gray shading represents the cortical gray matter. Darker shading shows the cross-sectional extent of HG. Filled circle within represents the location of the electrode at that recording site.
Fig. 2.
Fig. 2.
Series 1: average evoked potentials (AEPs) in response to click trains at 6 click rates at each of the recording sites shown in Fig. 1. All-pass AEPs (black) obtained with filters set between 1.6 and 1,000 Hz. Superimposed high-pass waveforms (red) AEPs obtained with high-pass filter set to 1 octave below the click-train frequency. Click rate and configuration shown across top of figure. Stimulus duration: 160 ms. Note the different voltage scale for all-pass and high-pass waveforms.
Fig. 3.
Fig. 3.
Series 1: peak-to-peak amplitude of the AEP plotted as a function of contact number for click rates of 100, 125, 150, and 200 Hz for each of 9 subjects. To the left of each set of curves is the MRI of the superior temporal plane showing the location of electrode contacts in HG (see Fig. 1 for details). Dashed lines indicate the estimated transition between auditory core and belt fields. Representative contacts within core and belt from which data are presented in Fig. 4 are indicated by closed and open arrows, respectively. The shaded area in H identifies those recording sites that fell outside of the gray matter of HG in this subject.
Fig. 4.
Fig. 4.
Series 1: phase-locking to click trains represented as power (top) and log power (bottom) in the AEP as a function of click rate for the representative brain sites (arrows in Fig. 3) in posteromedial (circles) and anterolateral HG (squares) in 9 subjects presented in Fig. 3. Power measurements made in response (300 ms poststimulus onset) and reference (300 ms prestimulus) intervals of the AEP waveforms are shown by filled and open symbols, respectively.
Fig. 5.
Fig. 5.
Means of power change values (±SE) of AEPs recorded from representative posteromedial and anterolateral HG sites shown by arrows in Fig. 3 in response to 6 click rates of series 1. Result of a mixed-effect regression and post hoc analyses given in text.
Fig. 6.
Fig. 6.
Time-frequency analysis of data shown in Fig. 2. The analysis, carried out on a trial-by-trial basis, was performed using a wavelet transform based on complex Morlet wavelets. Event-related band power (ERBP) was calculated on a trial-by-trial basis relative to baseline power measured in the 300-ms reference period before stimulus onset (color bar). Results of these single-trial calculations were averaged and represented as a plot of power on the time-vs.-frequency axis.
Fig. 7.
Fig. 7.
Temporal relationships between AEP waveform and time-frequency plots for 6 click rates used in series 1. Vertical arrows in A indicate peaks of ERBP bursts in response to the 25-Hz click train. Horizontal arrows point to click frequencies and their harmonics.
Fig. 8.
Fig. 8.
Series 2: AEPs in response to click trains at 6 click rates at each of the recording sites shown in Fig. 1. Click rate and configuration shown across top of figure. Stimulus duration: 1 s. Filter: 1.6-1,000 Hz.
fig. 9.
fig. 9.
Time frequency analysis of data shown in Fig. 8. See legend of Fig. 6 for details.
Fig. 10.
Fig. 10.
Time-frequency analysis of data shown in Fig. 2 obtained at recording sites of maximal responsiveness in posteromedial HG (left) and anterolateral HG (right) at click rates of 25 and 125 Hz. Total power (TP) shown in top panels of each pair. Non–phase-locked power (NPLP), obtained by subtracting the AEP from each of the single-trial responses, shown in bottom panels of each pair. ERBP color scale and a schematic of the stimulus shown below.
fig. 11.
fig. 11.
Time-frequency analysis of data shown in Fig. 8. See legend of Fig. 10 for details.

Similar articles

Cited by

References

    1. Bailey P, Bonin G. The Isocortex of Man Urbana, IL: University of Illinois Press, 1951, p. 1–301
    1. Bendor D, Wang X. The neuronal representation of pitch in primate auditory cortex. Nature 436: 1161–1165, 2005 - PMC - PubMed
    1. Bendor D, Wang X. Cortical representations of pitch in monkeys and humans. Curr Opin Neurobiol 16: 391–399, 2006 - PMC - PubMed
    1. Bendor D, Wang X. Differential neural coding of acoustic flutter within primate auditory cortex. Nat Neurosci 10: 763–771, 2007 - PubMed
    1. Bendor D, Wang X. Neural response properties of core fields AI, R, and RT in the auditory cortex of marmoset monkeys. J Neurophysiol 2008 - PMC - PubMed

Publication types

LinkOut - more resources