. 2009 Oct;297(4):C979-89.
doi: 10.1152/ajpcell.00577.2008. Epub 2009 Aug 12.

Secretory state regulates Zn2+ transport in gastric parietal cell of the rabbit

Affiliations

Secretory state regulates Zn2+ transport in gastric parietal cell of the rabbit

Haley B Naik et al. Am J Physiol Cell Physiol. 2009 Oct.

Abstract

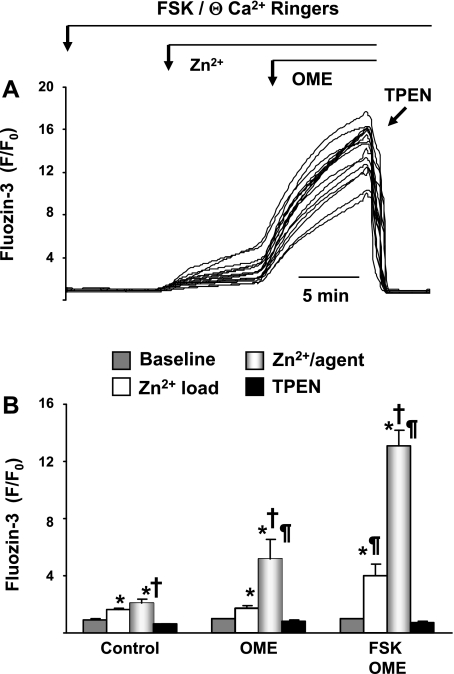
Secretory compartments of neurons, endocrine cells, and exocrine glands are acidic and contain high levels of labile Zn2+. Previously, we reported evidence that acidity is regulated, in part, by the content of Zn2+ in the secretory [i.e., tubulovesicle (TV)] compartment of the acid-secreting gastric parietal cell. Here we report studies focusing on the mechanisms of Zn2+ transport by the TV compartment in the mammalian (rabbit) gastric parietal cell. Uptake of Zn2+ by isolated TV structures was monitored with a novel application of the fluorescent Zn2+ reporter N-(6-methoxy-8-quinolyl)-para-toluenesulfonamide (TSQ). Uptake was suppressed by removal of external ATP or blockade of H+-K+-ATPase that mediates luminal acid secretion. Uptake was diminished with dissipation of the proton gradient across the TV membrane, suggesting Zn2+/H+ antiport as the connection between Zn2+ uptake and acidity in the TV lumen. In isolated gastric glands loaded with the reporter fluozin-3, inhibition of H+-K+-ATPase arrested the flow of Zn(2+) from the cytoplasm to the TV compartment and secretory stimulation with forskolin enhanced vectorial movement of cytoplasmic Zn2+ into the tubulovesicle/lumen (TV/L) compartment. Our findings suggest that Zn2+ accumulation in the TV/L compartment is physiologically coupled to secretion of acid. These findings offer novel insight into mechanisms regulating Zn2+ homeostasis in the gastric parietal cell and potentially other cells in which acidic subcellular compartments serve signature functional roles.


Figures

Fig. 1.
Fig. 1.
Characterization of tubulovesicles (TVs) isolated from rabbit gastric mucosa. A: brightfield visualization of isolated TVs prepared as reported in text (×40, oil immersion). B: Western blot using anti-Na+-K+-ATPase antibodies (α1-subunit) and anti-H+-K+-ATPase antibodies (α-subunit) of 3 preparations: whole mucosa (M), isolated gastric glands (G), and isolated TVs (T). Depletion of Na+-K+-ATPase and enrichment of H+-K+-ATPase in the TV preparation are observed. C: visualization of fluorescence of isolated TVs loaded with N-(6-methoxy-8-quinolyl)-para-toluenesulfonamide (TSQ, 40 μM) for 20 min, with excitation at 360 nm and emission at 520 nm in intracellular buffer (ICB) solution adjusted to contain 5 μM Zn2+ (image ×40, oil immersion; same scale as A).
Fig. 2.
Fig. 2.
Zn2+ content in TVs in response to extravesicular depletion of ATP or inhibition of H+-K+-ATPase. A: with a TSQ loading protocol, content of Zn2+ was assessed after equilibration with ICB solutions containing incrementally increasing levels of free Zn2+, in the presence or absence of ATP (0.5 mM). Results are expressed as means ± SE; each column represents n = 18 wells in 5 experiments. B: content of Zn2+ was assessed after equilibration with ICB solutions containing incrementally increasing levels of free Zn2+, under control conditions (ICB alone) or in the presence of proton pump inhibitors [Sch-28080 or omeprazole (Ome)]. Results are expressed as means ± SE; each column represents n = 21 wells in 4 experiments. P < 0.05 compared with measurements in the absence of Zn2+; *P < 0.05 compared with corresponding measurement in standard ICB. Ex, excitation; Em, emission.
Fig. 3.
Fig. 3.
ATPase activity and changes of Zn2+ content in the TV compartment. A: with a TSQ loading protocol, Zn2+ content was assessed after equilibration with ICB solutions containing incrementally increasing levels of free Zn2+, under control conditions or in the presence of orthovanadate (1 mM). Results are expressed as means ± SE; each column represents n = 15 wells in 3 experiments. B: measurements of p-nitrophenylphosphatase (pNPPase) activity (a surrogate for all ATPase activity) in isolated TVs. P < 0.05 compared with measurements in the absence of Zn2+; *P < 0.05 compared with corresponding measurement in standard ICB. Results are expressed as means ± SE; each column represents n = 15 wells in 3 experiments. Similar to results observed in response to proton pump inhibitors, inhibition of ATPase activity attenuated, but did not eliminate, uptake of Zn2+.
Fig. 4.
Fig. 4.
Relationship between Zn2+ and H+ gradient across the membranes of isolated TVs. Isolated TVs were exposed to ICB solutions alone or those containing the protonophore FCCP (20 μM), which dissipates the H+ gradient across the vesicular membrane. Uptake of Zn2+ was monitored in solutions containing different levels of free Zn2+. Results are expressed as means ± SE; n = 25 wells in 5 separate experiments. *P < 0.05 compared with baseline (ICB containing EGTA and no added Zn2+); P < 0.05 compared with ICB containing no FCCP.
Fig. 5.
Fig. 5.
Responses of TVs loaded with LysoSensor DND-160 to incremental changes in pH. TVs were loaded with the reporter after equilibration with ICB solution and the protonophores FCCP and nigericin. A: fluorescence at different emission wavelengths (460 or 528 nm) after excitation at 360 nm, showing inverse responses to incremental increases in pH (n = 30 wells in 6 individual experiments). Results are expressed as means ± SE. B: ratio of responses at each pH shown in A; arrow indicates location of the average level in wells before any experimental manipulation and corresponding to a “baseline” pH of 6.2 ± 0.6.
Fig. 6.
Fig. 6.
Relationship between Zn2+ and H+ content in isolated TVs. A: TVs loaded with LysoSensor DND-160 were equilibrated with ICB alone or ICB containing omeprazole (100 μM). All solutions contained valinomycin (10 μM) to enhance activity of the proton pump. Fluorescence was read at different emission wavelengths (460 or 528 nm) after excitation at 360 nm. Results are expressed as percent change (Δ%) from baseline (means ± SE; n = 24 wells in 4 separate experiments). *P < 0.05 compared with time 0 min. B: TVs loaded with LysoSensor DND-160 and exposed for 10 min to different concentrations of Zn2+ in ICB, under baseline conditions or in the presence of omeprazole (100 μM). Results are expressed as means ± SE; each bar represents n = 24 wells in 4 separate experiments. *P < 0.05 compared with ICB containing ∼0 nM Zn2+; P < 0.05 compared with ICB containing no omeprazole.
Fig. 7.
Fig. 7.
Validation of fluozin-3 for measurements of intracellular Zn2+ concentration ([Zn2+]i) in parietal cells of the rabbit gastric gland. A: fluozin-3 loading and characterization in gastric parietal cells. Digital image in grayscale of an isolated rabbit gastric gland, loaded with fluozin-3-2 AM (6 μM) for 25 min. Fluorescence was excited at 488 nm when perfused with Ringer solution (image at ×30). B: contributions of noncytoplasm compartments to the fluozin-3 signal. The gland is loaded with fluozin-3 and superfused initially with Ringer solution, followed by ICB ([Ca2+] ∼180 nM) containing 50 μM pyrithione and 5 nM Zn2+ in order to clamp [Zn2+]i. After removal of pyrithione, the gland is permeabilized with 10 μM digitonin, which permits egress of each dye from the cytoplasm only. Mag-fura-2 has been coloaded and serves as control to demonstrate the completeness of permeabilization (see text). Left y-axis reports fluorescence of mag-fura-2 at individual wavelengths of excitation (340, 380 nm). Right y-axis reports the fluorescence of fluozin-3. C: calibration responses of fluozin-3 in gastric glands (n = 22 cells in 3 glands). Each data point indicates mean ± SD. Calculated Kd of fluozin-3 for Zn2+ is 4.7 ± 0.4 nM (mean ± SE). F/F0, ratio of fluorescence at time t over baseline.
Fig. 8.
Fig. 8.
Impairment of Zn2+ disposal from the cytoplasm during inhibition of acid secretion. A: recording of fluozin-3 fluorescence in a single gastric gland during exposure to Ringer solutions containing 0 Ca2+ and 60 μM Zn2+. After exposure to Zn2+, exposure to N,N,N′,N′-tetrakis-(2-pyridylmethyl)ethylenediamine (TPEN, 10 μM) quenches all fluozin-3 activity, demonstrating that signals are due to Zn2+. Each line represents a recording of a single parietal cell in the gland. B: recording of fluozin-3 fluorescence in a single gastric gland under conditions similar to those in A, but with introduction of omeprazole (100 μM) midway during the exposure to Zn2+. Again, exposure to TPEN quenches all fluozin-3 activity at the end of the experiment. C: summary of studies. Control studies summarize results of exposure of gastric glands to Zn2+ alone for 20 min, showing results (means ± SE) for measurements at 4 time points: 1) baseline; 2) at the end of the first 10-min exposure to Zn2+; 3) at the end of the second 10-min exposure to Zn2+ (at baseline or in the presence of a proton pump inhibitor); 4) after quenching by TPEN. Each column represents n = 6–8 individual experiments. *Comparison with baseline; †comparison with first 10 min peak effect; comparison with responses under control conditions.
Fig. 9.
Fig. 9.
Enhancement of Zn2+ disposal from the cytoplasm during stimulation of acid secretion. A: recording of fluozin-3 fluorescence in a single gastric gland pretreated in DMEM containing the cAMP/PKA agonist forskolin (5 μM, 40 min) and then mounted in the microscope chamber and perfused with Ringer solutions containing forskolin, 0 Ca2+, and 60 μM Zn2+. After exposure to Zn2+, exposure to TPEN (10 μM) quenches all fluozin-3 activity, demonstrating that signals are due to Zn2+. Each line represents a recording of a single parietal cell in the gland. B: summary of studies. Control studies summarize results of exposure of gastric glands to Zn2+ alone for 20 min, showing results (means ± SE) for measurements at 4 time points: 1) baseline; 2) at the end of the first 10-min exposure to Zn2+; 3) at the end of the second 10-min exposure to Zn2+ (at baseline or in the presence of a proton pump inhibitor); 4) after quenching by TPEN. Each column represents n = 6–8 individual experiments. *Comparison with baseline; †comparison with first 10-min peak effect; comparison with responses under control conditions.

Similar articles

Cited by

References

    1. Agnew BJ, Duman JG, Watson CL, Coling DE, Forte JG. Cytological transformations associated with parietal cell stimulation: critical steps in the activation cascade. J Cell Sci 112: 2639–2646, 1999 - PubMed
    1. Akagi K, Nagao T, Urushidani T. Reconstitution of acid secretion in digitonin-permeabilized rabbit gastric glands. Identification of cytosolic regulatory factors. J Biol Chem 276: 28171–28172, 2001 - PubMed
    1. Ammar DA, Zhou R, Forte JG, Yao X. Syntaxin 3 is required for cAMP-induced acid secretion: streptolysin O-permeabilized gastric gland model. Am J Physiol Gastrointest Liver Physiol 282: G23–G33, 2002 - PubMed
    1. Andrews JC, Nolan JP, Hammerstedt RH, Bavister BD. Characterization of N-(6-methoxy-8-quinolyl)-p-toluenesulfonamide for the detection of zinc in living sperm cells. Cytometry 21: 153–159, 1995 - PubMed
    1. Arslan P, Di Virgilio F, Beltrame M, Tsien RY, Pozzan T. Cytosolic Ca2+ homeostasis in Ehrlich and Yoshida carcinomas. A new, membrane-permeant chelator of heavy metals reveals that these ascites tumor cell lines have normal cytosolic free Ca2+. J Biol Chem 260: 2719–2727, 1985 - PubMed

Publication types

LinkOut - more resources