

Missing data in randomized clinical trials for weight loss: scope of the problem, state of the field, and performance of statistical methods
- PMID: 19675667
- PMCID: PMC2720539
- DOI: 10.1371/journal.pone.0006624
Missing data in randomized clinical trials for weight loss: scope of the problem, state of the field, and performance of statistical methods
Abstract
Background: Dropouts and missing data are nearly-ubiquitous in obesity randomized controlled trails, threatening validity and generalizability of conclusions. Herein, we meta-analytically evaluate the extent of missing data, the frequency with which various analytic methods are employed to accommodate dropouts, and the performance of multiple statistical methods.
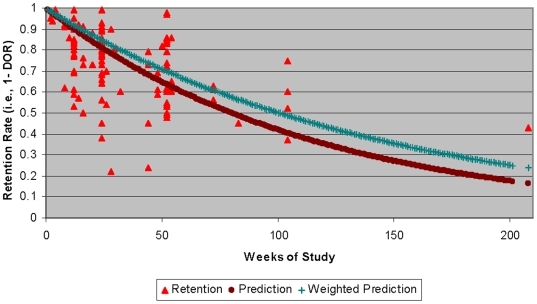
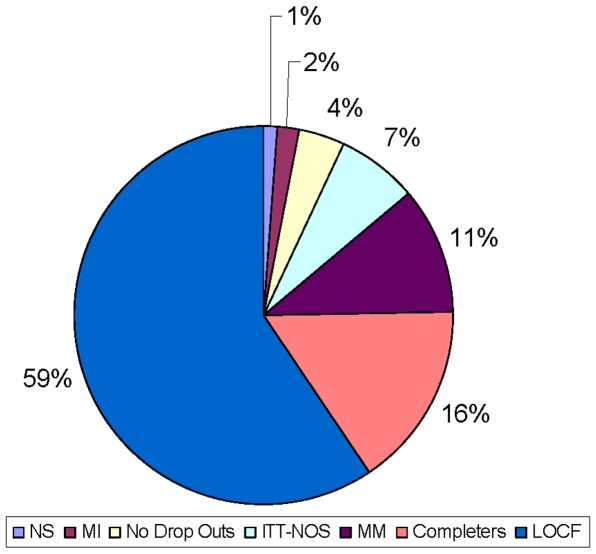
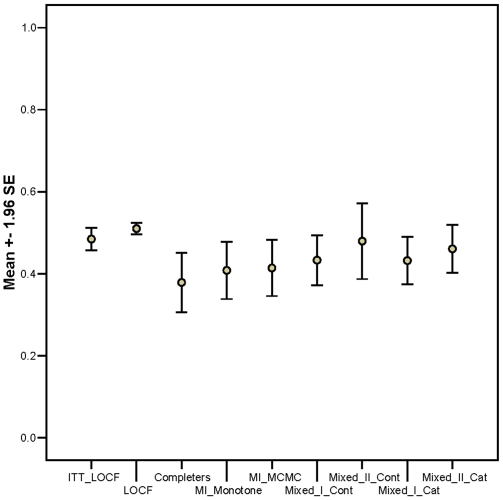
Methodology/principal findings: We searched PubMed and Cochrane databases (2000-2006) for articles published in English and manually searched bibliographic references. Articles of pharmaceutical randomized controlled trials with weight loss or weight gain prevention as major endpoints were included. Two authors independently reviewed each publication for inclusion. 121 articles met the inclusion criteria. Two authors independently extracted treatment, sample size, drop-out rates, study duration, and statistical method used to handle missing data from all articles and resolved disagreements by consensus. In the meta-analysis, drop-out rates were substantial with the survival (non-dropout) rates being approximated by an exponential decay curve (e(-lambdat)) where lambda was estimated to be .0088 (95% bootstrap confidence interval: .0076 to .0100) and t represents time in weeks. The estimated drop-out rate at 1 year was 37%. Most studies used last observation carried forward as the primary analytic method to handle missing data. We also obtained 12 raw obesity randomized controlled trial datasets for empirical analyses. Analyses of raw randomized controlled trial data suggested that both mixed models and multiple imputation performed well, but that multiple imputation may be more robust when missing data are extensive.
Conclusion/significance: Our analysis offers an equation for predictions of dropout rates useful for future study planning. Our raw data analyses suggests that multiple imputation is better than other methods for handling missing data in obesity randomized controlled trials, followed closely by mixed models. We suggest these methods supplant last observation carried forward as the primary method of analysis.
Conflict of interest statement
Figures
References
-
- NIDDK. Obesity Clinical Research. 2004. http://www.niddk.nih.gov/patient/patientobesity.htm. Accessed 2006 May 25.
-
- Calle EE, Thun MJ. Obesity and cancer. Oncogene. 2004;23(38):6365–6378. - PubMed
-
- Fontaine KR, Redden DT, Wang C, Westfall AO, Allison DB. Years of life lost due to obesity. JAMA. 2003;289(2):187–193. - PubMed
-
- Ogeden CL, Carroll MD, Curtin LR, et al. Prevalence of overweight and obesity in the United States 1999–2004. JAMA. 2006;295(13):1549–1555. - PubMed
-
- Cattell RB, Jaspars J. A general plasmode (No. 30-10-5-2) for factor analytic exercises and research. Multivariate Behavioral Research Monographs. 1967;67:1–212.
Publication types
MeSH terms
Grants and funding
LinkOut - more resources
Full Text Sources
Other Literature Sources
Medical
Miscellaneous
