Comparative Study
. 2009 Aug 13;4(8):e6623.
doi: 10.1371/journal.pone.0006623.

A comparative neuroanatomical study of the red nucleus of the cat, macaque and human

Affiliations
Comparative Study

A comparative neuroanatomical study of the red nucleus of the cat, macaque and human

Satoru Onodera et al. PLoS One. .

Abstract

Background: The human red nucleus (Nr) is comparatively less well-studied than that of cats or monkeys. Given the functional importance of reticular and midbrain structures in control of movement and locomotion as well as from an evolutionary perspective, we investigated the nature and extent of any differences in Nr projections to the olivary complex in quadrupedal and bipedal species. Using neuroanatomical tract-tracing techniques we developed a "neural sheet" hypothesis allowing us to propose how rubro-olivary relations differ among the three species.

Methods and findings: Wheat germ agglutinin-horseradish peroxidase staining supports findings that the cat's nucleus accessories medialis of Bechtrew (NB) projects mainly to the lateral bend of the principal olive. We clarified boundaries among nucleus of Darkschewitsch (ND), NB and parvicellular red nucleus (pNr) of the cat's neural sheet. The macaque's ND-medial accessory olivary projection is rostro-caudally organized and the dorsomedial and ventrolateral parts of the macaque's pNr may project to the principal olive's rostral and caudal dorsal lamella; in cat it projects as well to pNr. Myelin- and Nissl-stained sections show that a well-developed dorsomedial part of the human Nr consists of densely packed cells, deriving small myelinated fibers that continue into the medial central tegmental tract.

Conclusions: Based on these findings we suggest there are distinct bipedal-quadrupedal differences for Nr projections to the olivary complex. We propose the Nr of cats and monkeys comprise the ND, NB and pNr in a zonal sheet-like structure, retaining clear nuclear boundaries and an isolated, well-developed mNr. The human NB may be distinguished from its more specialised ND (ND lies alongside a well-developed pNr) in the human central gray. Phylogenetically, the NB may have been translocated into a roll-shaped Nr in the reticular formation, the dorsomedial portion of which might correspond to the cat's and monkey's NB.


Conflict of interest statement

Competing Interests: The authors have declared that no competing interests exist.

Figures

Figure 1
Figure 1. WGA-HRP injection sites in cat's inferior olivary complex (case 1 and 2).
The upper two columns comprise a scale drawing of the distribution of injected WGA-HRP solution in the cat's inferior olivary complex in case 1 and 2. The Roman numerals (II-XIV) represent levels of the inferior olivary complex from caudal to rostral (Brodal, 1940 [60]). The crossed stripes indicate a heavily stained area. Lower photomicrographs show the maximal extent of injected wheat germ agglutinin-horseradish peroxidase (WGA-HRP) at the olivary level (Fig. 1) in case 1 (A) and case 2 (B). DAO–dorsal accessory olive, MAO–medial accessory olive, PO–principal olive, vlpNr–ventorlateral part of parvicellular red nucleus, β–nucleus β. Scale bar = 500 µm in B (also applies to A).
Figure 2
Figure 2. Distribution of WGA-HRP-labelled cells in mesodiencephalic structures (case 1).
Successive serial sections are rostrally arranged, i.e., section A is the most rostral. The number in the left corner of each photomicrograph is the rostrocaudal distance (in micrometers) from section A. AM–anteromedian nucleus, dmpNr–dorsomedial part of parvicellular red nucleus, EW–Edinger-Westphal nucleus, FF–Field of Forel, FR–fasciculus retroflexus, MLF–medial longitudinal fasciculus, mNr–magnocellular red nucleus, MTN–medial terminal nucleus, NB–nucleus accessorius medialis of Bechterew, ND–nucleus of Darkschewitsch, Nint–interstitial nucleus of Cajal, Pf–parafascicular nucleus, riMLF–rostral interstitial nucleus of MLF, sPf–subparafascicular nucleus, sRF–suprarubral reticular formation, vlpNr–ventorlateral part of parvicellular red nucleus, III–oculomotor nucleus. Scale bar = 200 µm in P (also applies to A–O).
Figure 3
Figure 3. Distribution of WGA-HRP-labelled cells in mesodiencephalic structures (case 2).
Successive serial sections are rostrally arranged, i.e., section A is the most rostral. dmpNr–dorsomedial part of parvicellular red nucleus, EW–Edinger-Westphal nucleus, FR–fasciculus retroflexus, NB–nucleus accessorius medialis of Bechterew, ND–nucleus of Darkschewitsch, Nint–interstitial nucleus of Cajal, III–oculomotor nucleus. Scale bar = 200 µm in I (also applies to A–H).
Figure 4
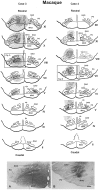
Figure 4. WGA-HRP injection sites in macaque's inferior olivary complex (case 3 and 4).
The upper two columns comprise a scale drawing of the distribution of injected WGA-HRP solution in the macaque's inferior olivary complex in case 3 and 4. The Roman numerals (II–XII) represent levels of the inferior olivary complex from caudal to rostral (Brodal and Brodal, 1981 [61]). The crossed stripes indicate a heavily stained area. Lower photomicrographs show the maximal extent of injected WGA-HRP at the olivary level in case 3 (Fig. A) and case 4 (Fig. B). DAO–dorsal accessory olive, dc–dorsal cap, dmcc–dorsomedial cell column, MAO–medial accessory olive, PO–principal olive, vlo–ventrolateral outgrowth, β–nucleus β. Scale bar = 500 µm in B (also applies to A).
Figure 5
Figure 5. Distribution of WGA-HRP-labelled cells in mesodiencephalic structures (case 3).
Drawings are arranged rostrocaudally; section A is the most rostral. One dot represents one labelled cell. Large dot shows a large labelled cell. dmpNr–dorsomedial part of parvicellular red nucleus, FR–fasciculus retroflexus, mNr–magnocellular red nucleus, NB–nucleus accessorius medialis of Bechterew, ND–nucleus of Darkschewitsch, Nint–interstitial nucleus of Cajal, vlpNr–ventorlateral part of parvicellular red nucleus, III–oculomotor nucleus.
Figure 6
Figure 6. Distribution of WGA-HRP-labelled cells in mesodiencephalic structures (case 4).
Drawings are arranged rostrocaudally; section A is the most rostral. One dot represents one labelled cell. Large dot shows a large labelled cell. dmpNr–dorsomedial part of parvicellular red nucleus, FR–fasciculus retroflexus, mNr–magnocellular red nucleus, NB–nucleus accessorius medialis of Bechterew, ND–nucleus of Darkschewitsch, Nint–interstitial nucleus of Cajal, vlpNr–ventorlateral part of parvicellular red nucleus, III–oculomotor nucleus.
Figure 7
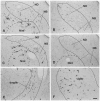
Figure 7. Distribution of WGA-HRP-labelled cells in mesodiencephalic structures (case 3 and 4).
A (case 3) and B (case 4): rostral part of ND, C (case 3) and D (case 4): caudal part of ND. E (case 3): dmpNr. F (case 4): vlpNr. dmpNr–dorsomedial part of parvicellular red nucleus, NB–nucleus accessorius medialis of Bechterew, ND–nucleus of Darkschewitsch, vlpNr–ventorlateral part of parvicellular red nucleus. Scale bar = 100 µm in F (also applies to A–E).
Figure 8
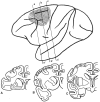
Figure 8. WGA-HRP injected sites in macaque's cerebral cortex (case 5).
Upper drawing shows the expansion of the injected WGA-HRP solution indicated by oblique lines in a lateral view of the macaque's cerebral cortex. Lower drawing shows multiple injection sites (small dots) in the frontal section. A, B and C indicates a-a', b-b' and c-c' in upper drawing, respectively.
Figure 9
Figure 9. Distribution of WGA-HRP-labelled terminals in macaque's mesodiencephalic structures (case 5).
Labelled terminals were indicated by small dots. dmpNr–dorsomedial part of parvicellular red nucleus, FR–fasciculus retroflexus, mNr–magnocellular red nucleus, NB–nucleus accessorius medialis of Bechterew, ND–nucleus of Darkschewitsch, Nint–interstitial nucleus of Cajal, vlpNr–ventorlateral part of parvicellular red nucleus, III–oculomotor nucleus.
Figure 10
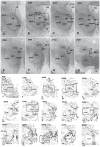
Figure 10. Human red nucleus and its surrounding structures.
Upper photomicrographs (A-H) showing distribution of myelinated fiber bundles stained by myelin stain in the human mesodiencephalic structure of successive serial sections. Section A is the most rostral. The human NB is the dorsomedial cell-rich area of the red nucleus. Scale bar = 500 µm in H (also applies to A–G). Lower scale drawing showing the distribution of Nissl-stained cells found in the human mesodiencephalic structure as indicated by dots in the drawings of 15 successive serial sections. Section 1 is the most rostral. Sections 13 and 14 show giant mNr cells as large dots indicated by arrowheads. The number in the left corner of each photomicrograph and drawing is the rostrocaudal distance (in micrometers) from the rostral tip of the red nucleus. (A) – (H) correspond to Figs. 11A–H. CTT–central tegmental tract, dmpNr–dorsomedial part of parvicellular red nucleus, EW–Edinger-Westphal nucleus, FR–fasciculus retroflexus, MLF–medial longitudinal fasciculus, mNr–magnocellular red nucleus, MTT–medial tegmental tract, NB–nucleus accessorius medialis of Bechterew, ND–nucleus of Darkschewitsch, SCP–superior cerebellar peduncle, vlpNr–ventorlateral part of parvicellular red nucleus, III–oculomotor nucleus, IV–trochlear nucleus.
Figure 11
Figure 11. Human parvicellular red nucleus.
Photomicrographs showing the distribution of Nissl-stained pNr cells in A(1), B(3), C(4), E(7), and F(10) which correspond to sections 1, 3, 4, 7 and 10 of Fig. 10 and the distribution of myelinated fiber bundles stained by myelin stain in D which corresponds to section Fig. 10B. The number in the left corner of each photomicrograph is the rostrocaudal distance (in micrometers) from the rostral tip of the red nucleus. CTT–central tegmental tract, dmpNr–dorsomedial part of parvicellular red nucleus, EW–Edinger-Westphal nucleus, FR–fasciculus retroflexus, MLF–medial longitudinal fasciculus, MTT–medial tegmental tract, NB–nucleus accessorius medialis of Bechterew, ND–nucleus of Darkschewitsch, Nint–interstitial nucleus of Cajal, vlpNr–ventorlateral part of parvicellular red nucleus. Scale bar = 200 µm in F (also applies to A–E).
Figure 12
Figure 12. Human magnocellular red nucleus.
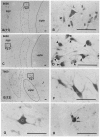
Photomicrographs showing the distribution of Nissl-stained mNr cells. A (11) and E (13) correspond to sections 11 and 13 in Fig. 10. C is a reversed photomicrograph of the contralateral side of A for comparison with C. The area indicated by a broken line is the outer layer of the semi-lunar shell of mNr (A, C and E). It exits between the capsule of the superior cerebellar peduncle and the parabrachial pigmented nucleus (PBP). B. High magnification views of large (L), medium (M) and small (S) neurons of the outer shell of mNr. D. Many pigmented cells exist in the parabrachial pigmented nucleus. Arrowheads indicate accumulation of pigment. E. Caudal end of vlpNr. Arrowhead indicates one giant neuron. F and G. Giant neurons among fibers of the superior cerebellar pedunculus. H. Large neuron contains pigments. Arrowhead indicates accumulation of pigment. The number in the left corner of each photomicrograph is the rostrocaudal distance (in micrometers) from the rostral tip of the red nucleus. PBP–parabrachial pigmented nucleus, vlpNr–ventorlateral part of parvicellular red nucleus. Scale bars = 100 µm in A–H.
Figure 13
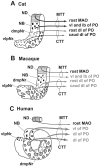
Figure 13. Neural sheet model of red nucleus.
A. In the cat, the poorly-developed neural sheet curves. B. In the macaque, the moderately developed neural sheet curves. C. In the human, the extremely well-developed neural sheet is completely rolled. The human NB is defined as the dorsomedial part of the red nucleus and it projects to the vl of PO via the medial part of the CTT. A strong stream of these well-developed CTT fibers separates the NB from ND. The gray color indicates a “still uncertain” projection. CTT–central tegmental tract, dmpNr–dorsomedial part of parvicellular red nucleus, lb–lateral bend, MAO–medial accessory olive, MTT–medial tegmental tract, NB–nucleus accessorius medialis of Bechterew, ND–nucleus of Darkschewitsch, PO–principal olive, vl–ventral lamella, vlpNr–ventorlateral part of parvicellular red nucleus.
Figure 14
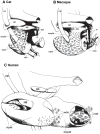
Figure 14. Three-dimensional models of red nucleus.
The mesodiencephalic nuclei of the cat (A), the macaque (B), and the human (C) as reconstructed using serial sections shown in Fig. 1 for cat; Figs. 7,8 and 11 for macaque; and a myelo- and cytoarchitectonic analysis in Figs. 10–12 for human. The rostral ends of these modeles toward left side. dmpNr–dorsomedial part of parvicellular red nucleus, EW–Edinger-Westphal nucleus, FR–fasciculus retroflexus, mNr–magnocellular red nucleus, NB–nucleus accessorius medialis of Bechterew, ND–nucleus of Darkschewitsch, vlpNr–ventorlateral part of parvicellular red nucleus, III–oculomotor nucleus.
Figure 15
Figure 15. Human cerebro-cerebellar system.
The medial cerebellar system receives cortical information from areas 4, 8 and 7 via the ND , , , . The lateral cerebellar system might not have been related only to skilful motor learning via areas 4, 6, 5 and 8 , , , , , but also to cognitive and language processing via the prefrontal cortico-rubral projection. CTT–central tegmental tract, dD–dorsal half of cerebellar dentate nucleus, dl–dorsal lamella, Gl–cerebellar globose nucleus, lb–lateral bend, MAO–medial accessory olive, MTT–medial tegmental tract, NB–nucleus accessorius medialis of Bechterew, ND–nucleus of Darkschewitsch, pNr–parvicellular red nucleus, PO–principal olive, vD–ventral half of cerebellar dentate nucleus, vl–ventral lamella, 4–motor area, 5–somatosensory association cortex, 6–premotor area, 7–posterior parietal cortex, 8–frontal eye field, 44–Broca's speech area.

Similar articles

Cited by

References

    1. Ogawa T. The tractus tegmenti medialis and its connection with the inferior olive in the cat. J Comp Neurol. 1939;70:19–36.
    1. Mannen H. A dendro-cyto-myeloarchitectonic atlas of cat's brain. 1988. Tokyo: Iwanami Shoten.
    1. Onodera S. Olivary projections from the mesodiencephalic structures in the cat studied by means of axonal transport of horseradish peroxidase and tritiated amino acids. J Comp Neurol. 1984;227:37–49. - PubMed
    1. Drew T, Jiang W, Kabiy B, Lavoie S. Role of the motor cortex in the control of visually triggered gait modifications. Can J Physiol Parmacol. 1996;74:426–442. - PubMed
    1. Lavoie S, Drew T. Discharge characteristics of neurons in the red nucleus during voluntary gait modifications: a comparison with the motor cortex. J Neurophysiol. 2002;88:1791–1814. - PubMed

Publication types