. 2009 Aug 13;63(3):329-41.
doi: 10.1016/j.neuron.2009.07.021.

Obesity-blocking neurons in Drosophila

Affiliations

Obesity-blocking neurons in Drosophila

Bader Al-Anzi et al. Neuron. .

Erratum in

  • Neuron. 2009 Oct 29;64(2):290-1

Abstract

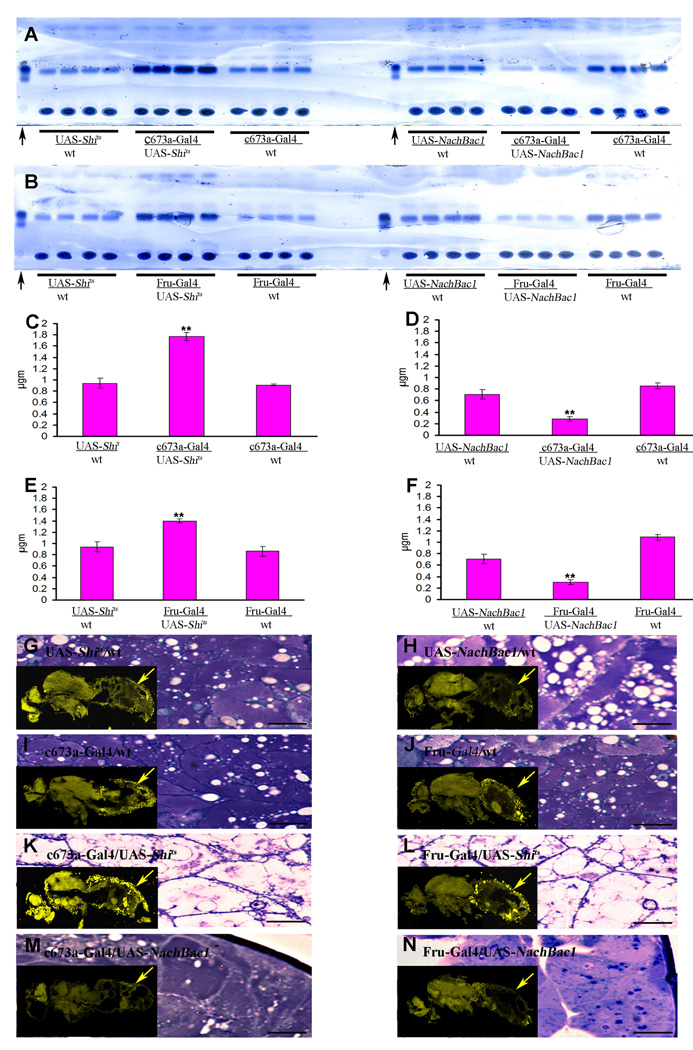
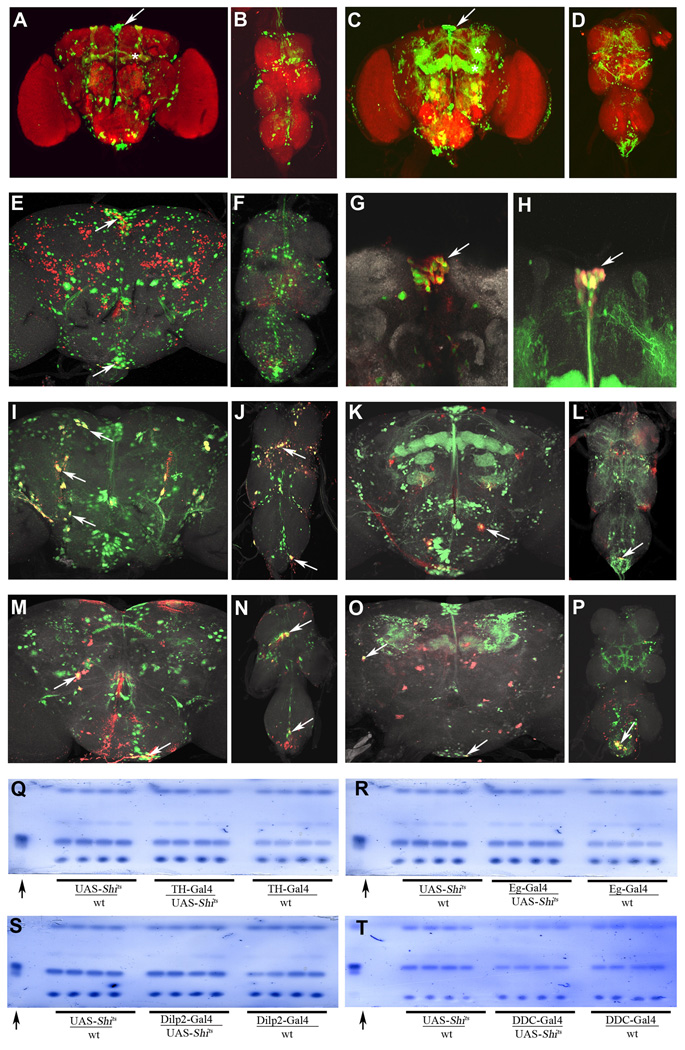
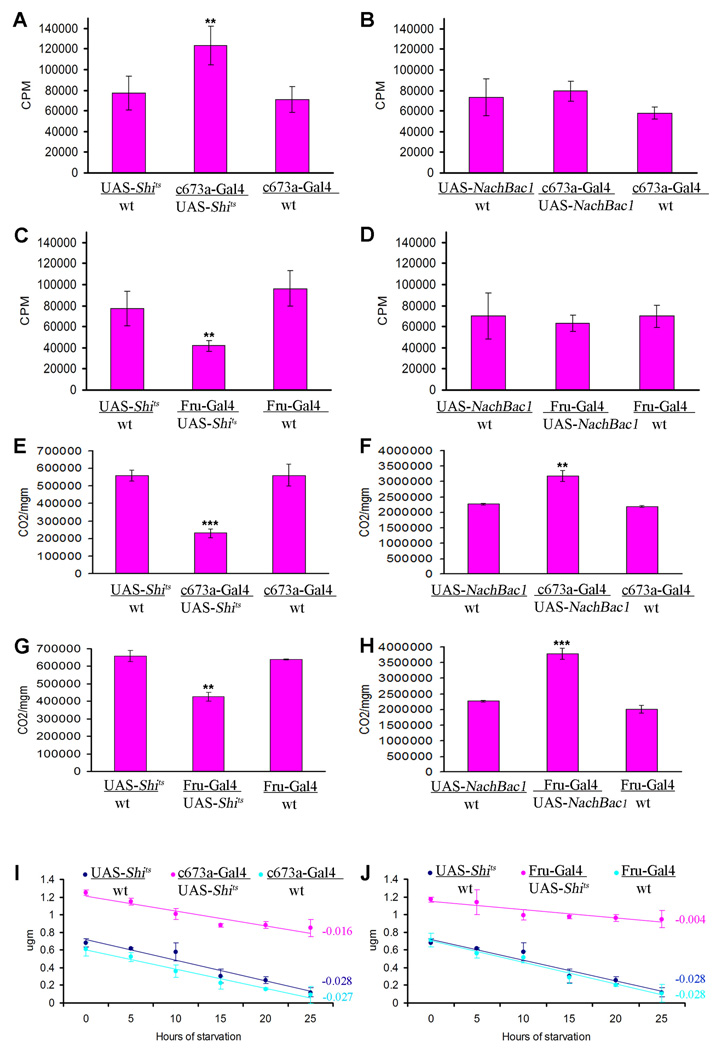
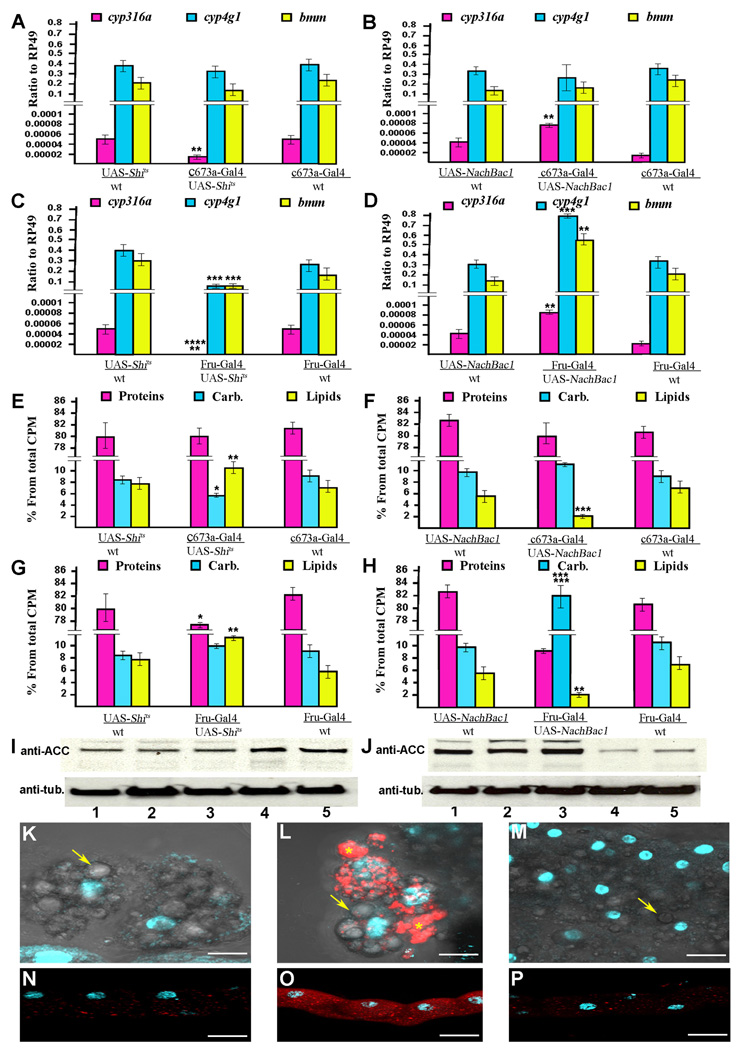
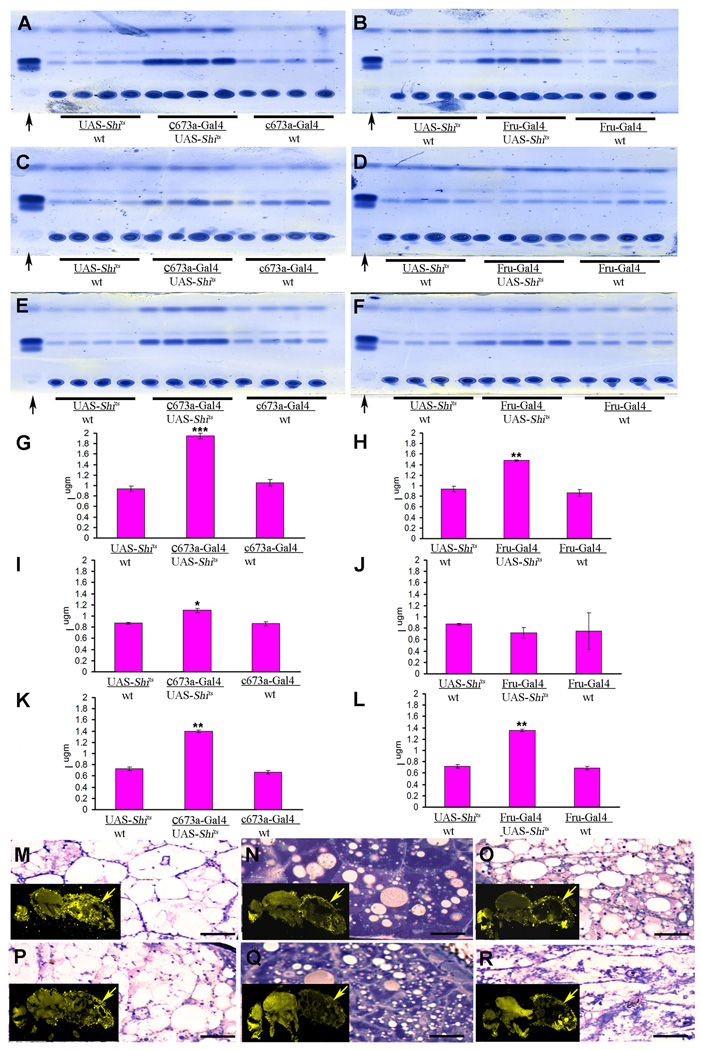
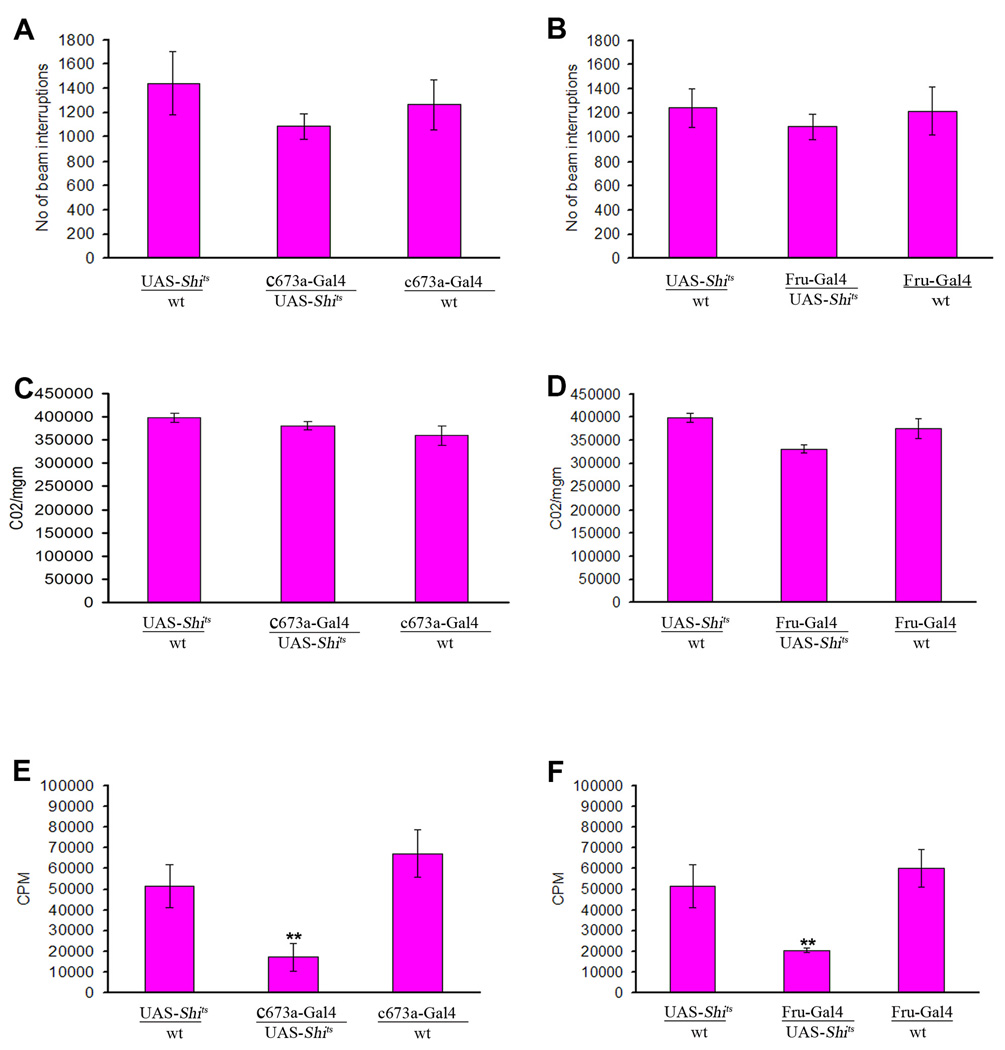
In mammals, fat store levels are communicated by leptin and insulin signaling to brain centers that regulate food intake and metabolism. By using transgenic manipulation of neural activity, we report the isolation of two distinct neuronal populations in flies that perform a similar function, the c673a-Gal4 and fruitless-Gal4 neurons. When either of these neuronal groups is silenced, fat store levels increase. This change is mediated through an increase in food intake and altered metabolism in c673a-Gal4-silenced flies, while silencing fruitless-Gal4 neurons alters only metabolism. Hyperactivation of either neuronal group causes depletion of fat stores by increasing metabolic rate and decreasing fatty acid synthesis. Altering the activities of these neurons causes changes in expression of genes known to regulate fat utilization. Our results show that the fly brain measures fat store levels and can induce changes in food intake and metabolism to maintain them within normal limits.


Figures

Figure 1
Figure 1
Alteration in neural activity of the c673a-Gal4 or Fru-Gal4 neurons produces changes in fly fat content. TLC assay showing two panels with four replicates for each of three genotypes (A and B). The flanking genotypes in each panel are from control flies with single transgenes, while the central panels are from flies with both transgenes. When UAS-Shits reduce synaptic transmission in the c673a-Gal4 or Fru-Gal4 neurons, an increase in fat band is observed (central right in panel A and B respectively). Over-activation of either set of neurons with UAS-NachBac1 produces a decrease in fat band (central left in panel A and B respectively). Arrows in both panels point to butter standard lanes. The same results are observed when triglyceride levels are directly measured (C–F). Flies bearing single transgenes show some yellow fat fluorescence as examined by Nile red histological staining (G–J). The experimental double transgene flies under UAS-Shits suppression show a large amount of fat as indicated by an increase in yellow fluorescence of Nile red histological staining (K and L, arrow), while over-activation of the same neurons causes a reduction in yellow fluorescence of fat stores (M and N, arrow). The same panels also show the fat cell morphology of those flies as examined by toluene blue stained plastic section (G–J). Error bars are standard deviation of five different replicas for a given genotype. Black bar in panel G to J represent distant of 100 µm. (Asterisks denote T-test statistical significance: *; P<0.05, **; P<0.01, ***; P<0.005).
Figure 2
Figure 2
The c673a-Gal4 neurons overlap only minimally with the Fru-Gal4 neurons. c673a-Gal4/2xUAS-GFP brain (A) showing the neurosecretory cluster (arrow), mushroom body (asterisks), and the ventral ganglion (B). Fru-Gal4/2xUAS-GFP brain (C) showing the neurosecretory cluster (arrow), mushroom body (asterisks), and the ventral ganglion (D). Anti-FruM (red in E and F) rarely co-stained the green c673a-Gal4/UAS-nuc-GFP neurons (green in E and F), with overlap occurring in only few yellow neurons in the neurosecretory cluster and subesophageal ganglion (E and F, arrows). Anti-DILP immunostaining (red in G and H) of c673a-Gal4/2xUAS-GFP neurons (green in G) and of Fru-Gal4/2xUAS-GFP neurons (green in H) indicates that most of the insulin expressing (DILP) neurons are both c673a-Gal4 and Fru-Gal4 positive (yellow in G and H, arrows). Immunostaining with the dopaminergic marker anti-tyrosine hydroxylase (red in I–L) show that most are also c673a-Gal4/2xUAS-GFP neurons (yellow in I and J, arrows), however, only few are Fru-Gal4/2x-UAS-GFP positive neurons (yellow in K and L, arrows). Anti-serotonin immunostaining (red in M–P) shows little overlap between serotonergic neurons and c673a-Gal4/2xUAS-GFP (green in M and N) and Fru-Gal4/2xUAS-GFP neurons (green in O and P). However, few c673a-Gal4 and Fru-Gal4 neurons in the subesophageal and ventral ganglion are serotonergic (yellow in M–P, arrows). Silencing of the few neurons shared between c673a-Gal4 and Fru-Gal4 does not affect fat store level. UAS-Shits silencing of dopaminergic neurons using TH-Gal4 (Q), serotonergic neurons using Eg-Gal4 (R), insulin expressing neurons by using Dilp2-Gal4 (S), or both dopaminergic and serotonergic neurons using DDC-Gal4 (T) does not produce changes in fly fat content compared to control flies with single transgenes as examined by the TLC assay. Arrows in TLC panels point to butter standard lanes.
Figure 3
Figure 3
Silencing of c673a-Gal4 neurons causes an increase in food intake when flies are exposed to 14C-labeled-leucine l food for 48 hours (A) , while silencing of Fru-Gal4 neurons produces the opposite effect as compared to controls (C). However, over-activation of either neuronal population does not produce any marked difference in radiation count as compared to control (B and D). Silencing of c673a-Gal4 and Fru-Gal4 neurons reduces metabolic rate and causes defects in fat store utilization. Reduction in CO2 emission is observed when either neuronal group is silenced (E and G) and an increase in CO2 emission is detected when they are over-activated (F and H). Measuring triglyceride levels in starved flies with 7 days silenced c673a-Gal4 or Fru-Gal4 neurons indicate a defect in their ability to utilize their fat stores as indicated by the gentler slope of their fat store depletion rate with continued starvation as compared to controls (I and J). Trendline was generated using Excel worksheet, and the slope value of a given trendline is color coded in the right side of each panel. Error bars are standard deviation of five different replicates for a given genotype. (Asterisks denote T-test statistical significance: *; P<0.05, **; P<0.01, ***; P<0.005).
Figure 4
Figure 4
Activity of c673a-Gal4 or Fru-Gal4 neurons affect the expression levels of genes involved in fat store utilization. cyp361a1 shows a marked reduction when c673a-Gal4 or Fru-Gal4 neurons are silenced, while their hyperactivation cause the opposite (A–D). Silencing of Fru-Gal4 neurons also causes a decrease in the expression levels of cyp4g, and bmm, while their hyperactivation causes the opposite (C and D, respectively). The neural activity of c673a-Gal4 and Fru-Gal4 neurons affect the ability of flies to convert 14C-labeled-leucine in their food to different macromolecular classes. Measurements of the percentage of the radiation signal in a given macromolecular class indicates that flies with silencing of c673a-Gal4 or Fru-Gal4 convert more 14C-labeled-leucine into fat than controls (E and G, respectively), while their hyperactivation produces the opposite (F and H, respectively). The increase in the fat radiation signal comes at the expense of the carbohydrate signal in c673a-Gal4 silenced flies (E) and protein signal in Fru-Gal4 silenced flies (G). Additionally, hyperactivation of Fru-Gal4 neurons causes a marked reduction in the protein radiation signal that is accompanied by a large increase in the carbohydrate radiation signal (H). Western blot analysis using anti-ACC indicates that these changes are associated with corresponding changes in the level of ACC enzyme; flies with silenced c673a-Gal4 or Fru-Gal4 neurons have an increase in ACC level (J4 and 5, respectively) as compared to their controls (J1, wt/UAS-Shits; 2 , c673-Gal4/wt; 3 , Fru-Gal4/wt, all were incubated in 30 °C), while flies with hyperactivated c673a-Gal4 and Fru-Gal4 neurons have lowered ACC signal (I4 and 5, respectively) as compared to their controls (I1, UAS-NachBac1/wt; 2, c673-Gal4/wt; 3 is Fru-Gal4/wt, all were incubated in room temperature). The massive shift of 14C signal into the carbohydrates observed in Fru-Gal4 hyperactivated flies is associated with an increase in autophiga in fat cells (L, asterisks designate an autophiga vesicle) and malipegian tubule cells (O). Control room temperature UAS-NachBac1/wt and Fru-Gal4/wt fat (K and M, respectively) and malipigian tubule cells (N and P, respectively) do not show such phenomena. Error bars are standard deviation of five different replicates for a given genotype. Arrows in K–M point to fat droplets, while blue color in K–P identifies nuclei stained with DAPI. White bar in panel K–M represent distant of 100 µm. anti-tub designates tubulin loading control in panel I-J.(Asterisks denote T-test statistical significance: *; P<0.05, **; P<0.01, ***; P<0.005).
Figure 5
Figure 5
The obesity phenotype of silenced c673a-Gal4 or Fru-Gal4 neurons is reversible. Flies with c673a-Gal4 or Fru-Gal4 neurons silenced for 14 days are obese as measured by the TLC assay (A and B), triglycerides assay (G and H), and Nile red staining (M:c673a-Gal4 and P:Fru-Gal4). When neural activity of 7 day silenced c673a-Gal4 and Fru-Gal4 flies is restored for another 7 days, close to normal fat level is observed by TLC assay (C, and D), triglycerides assay (I, and J), and Nile red histological staining (N: c673a-Gal4 and Q: Fru-Gal4). These changes in fat content have nothing to do with aging since flies with normal neuronal activity in either neuronal population for the first seven days, followed by silencing in the last seven days of the incubation are capable of becoming obese as measured by the TLC assay (E and F), triglycerides assay (K and L), and by Nile red and toluene blue histological staining (O: c673a-Gal4 and R;-Fru-Gal4). Arrows on the TLC plates point to butter standard .Error bars are standard deviation of five different replicates for each genotype. Black bar in panel M–R represent distant of 100 µm (Asterisks denote T-test statistical significance: *; P<0.05, **; P<0.01, ***; P<0.005).
Figure 6
Figure 6
The reversal of the obesity phenotype in flies with previously silenced c673-Gal4 or Fru-Gal4 neurons is due to reduction in food intake. The loss of excess fat in these flies is not associated with an increase in general activity as measured by the Trikinetics motion detector (A and B) or increase in metabolism as reviled revealed by CO2 emission (C and D), but is largely due to reduction in food intake as revealed by measuring 14C -labeled Leucine food intake for 48 hours (E and F). Error bars are standard deviation of five different replicas for a given genotype. (Asterisks denote T-test statistical significance: *; P<0.05, **; P<0.01, ***; P<0.005).

Comment in

References

    1. Armstrong JD, Kaiser K. The Study of Drosophila Brain Development. In: Houdebine LM, editor. Transgenic animals - generation and use. Harwood Academic Publishers; 1997.
    1. Barcelo H, Stewart MJ. Altering Drosophila S6 kinase activity is consistent with a role for S6 kinase in growth. Genesis. 34:83–85. - PubMed
    1. Barsh G, Schwartz M. Genetic approaches to studying energy balance: perception and integration. Nature Reviews. 2002;3(8):589–600. - PubMed
    1. Berthoud HR, Morrison C. The brain, appetite, and obesity. Annu Rev Psychol. 2008;59:55–92. - PubMed
    1. Billeter J, Goodwin SF. Characterization of Drosophila fruitless-gal4 transgenes reveals expression in male-specific fruitless neurons and innervation of male reproductive structures. J. Comp. Neurol. 2004;475:270–287. - PubMed

Publication types

MeSH terms