. 2009 Aug 13;63(3):386-96.
doi: 10.1016/j.neuron.2009.06.020.

Serial, covert shifts of attention during visual search are reflected by the frontal eye fields and correlated with population oscillations

Affiliations

Serial, covert shifts of attention during visual search are reflected by the frontal eye fields and correlated with population oscillations

Timothy J Buschman et al. Neuron. .

Abstract

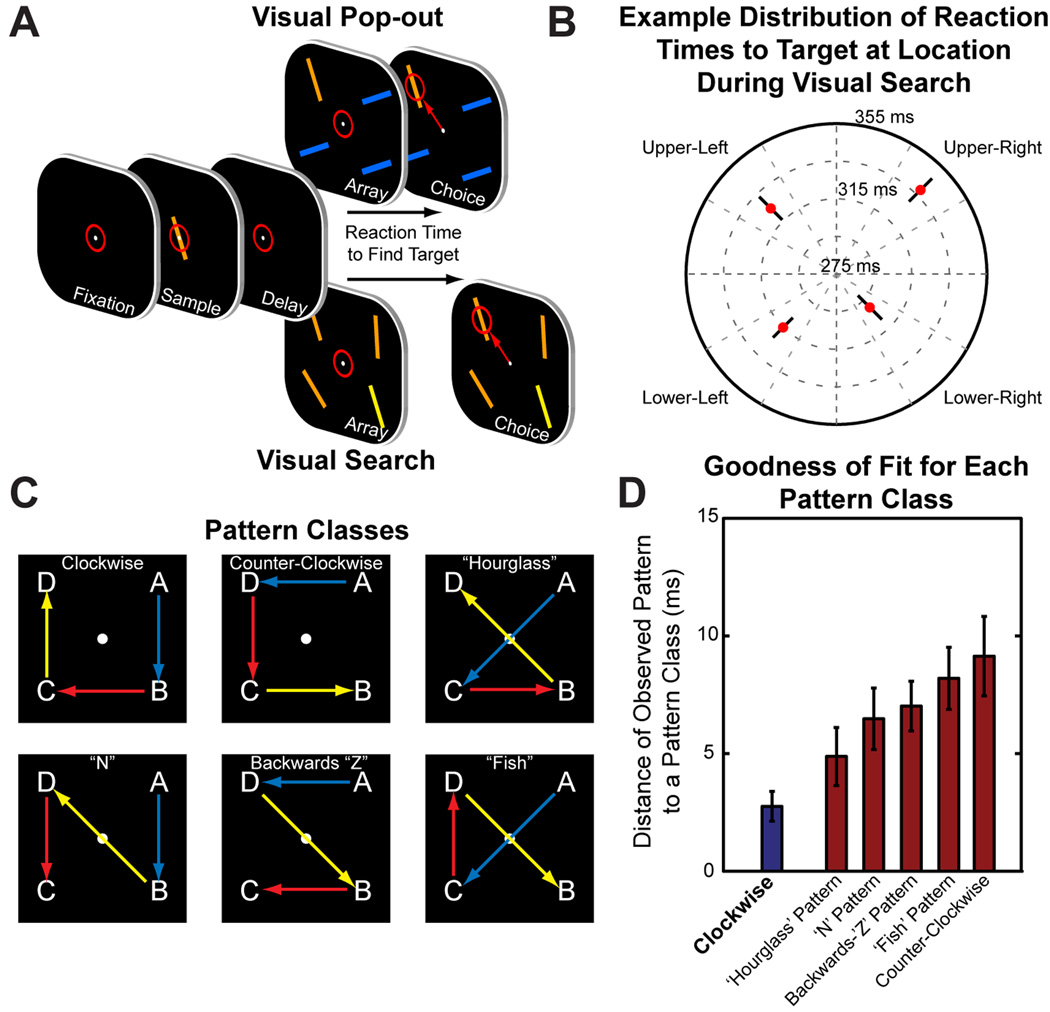
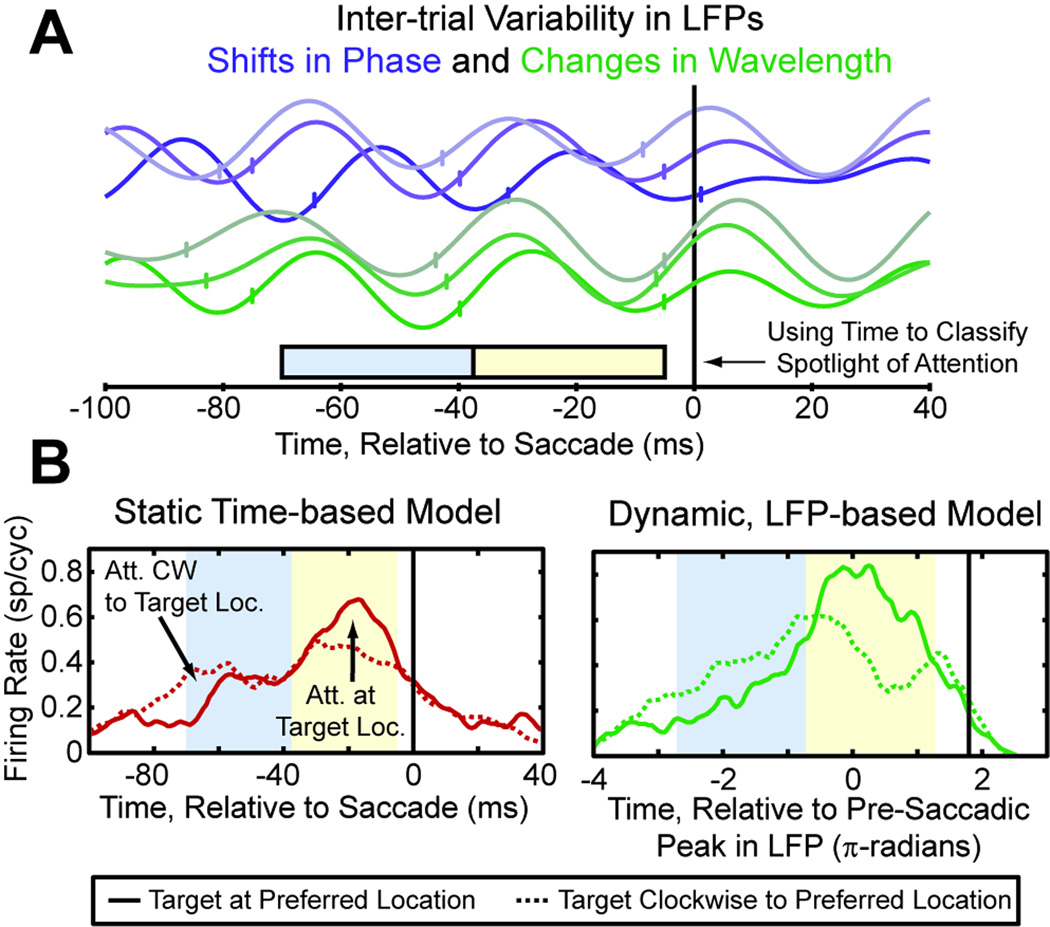
Attention regulates the flood of sensory information into a manageable stream, and so understanding how attention is controlled is central to understanding cognition. Competing theories suggest visual search involves serial and/or parallel allocation of attention, but there is little direct, neural evidence for either mechanism. Two monkeys were trained to covertly search an array for a target stimulus under visual search (endogenous) and pop-out (exogenous) conditions. Here, we present neural evidence in the frontal eye fields (FEF) for serial, covert shifts of attention during search but not pop-out. Furthermore, attention shifts reflected in FEF spiking activity were correlated with 18-34 Hz oscillations in the local field potential, suggesting a "clocking" signal. This provides direct neural evidence that primates can spontaneously adopt a serial search strategy and that these serial covert shifts of attention are directed by the FEF. It also suggests that neuron population oscillations may regulate the timing of cognitive processing.


Figures

Figure 1
Figure 1
(a) Task Design. Red circle indicates eye position. Both tasks required the animal to fixate to start the trial, followed by the sample stimulus (the eventual target to be found in the visual array). After a short memory delay, the visual array was presented and the animal was required to make a single, direct, saccade to the target location in order to receive a reward. Visual search and pop-out tasks only differed in how the distractors related to the target in the visual array. (b) Reaction time (RT) to find the target at each of the four possible locations from an example session of visual search (red circle shows the mean, black bar covers 95% confidence interval). The animal is fastest to react when the target is in the lower right, followed by lower left, etc. This ordering suggests the animal begins the search in the lower right and then proceeds clockwise. (c) Graphical depiction of all of the different search patterns tested. (d) Goodness-of-fit of the observed reaction time with all of the tested classes of patterns (see supplementary data for details of cost-analysis). The “Clockwise” pattern was significantly closer to the observed pattern than any other pattern tested.
Figure 2
Figure 2
Average normalized firing rate over time for location selective neurons in FEF (top row) and dlPFC (bottom row) during search (left column) and pop-out (right column). Correct trials within each task are sorted by the location of the target relative to the neuron’s preferred location (defined by activity in the 75 ms after the saccade). Color indicates the z-score of the average response above chance. Asterisks indicate when the activity across bins was significant by ANOVA at p < 0.05 after Bonferroni correction for multiple comparisons, while dots indicate an uncorrected p < 0.05. The neural activity in FEF during search shows a clockwise search pattern, matching the animal’s behavior. This effect is neither seen in dlPFC during search nor during the pop-out task. Note that the variability in the timing of activity increases with each added shift of attention before the saccade.
Figure 3
Figure 3
(a) Example LFP traces (FEF electrodes, filtered between 18–34 Hz). Two types of between-trial variations are shown: phase shifts (relative to saccade, shown in purple) and changes in wavelength (shown in green). A cycle of LFP is used to classify time periods into either attending to the target or clockwise locations. The windows used for the baseline time model are shown along the time axis for comparison. (b) Activity of an example neuron in response to the target being at (solid line), or clockwise to (dashed line), its preferred location. The left figure plots the firing rate over time, relative to the saccade (in red) and shows the effect of attention into the neuron’s preferred location. This difference can be enhanced by utilizing the trial-to-trial variability in the LFP signal (shown in green, right), improving our ability to distinguish where attention is directed. The average firing rate is now plotted with respect to the phase of the LFP signal (shown in shaded regions; cycles were relative to the peak preceding the saccade; black line marks average saccade).
Figure 4
Figure 4
(a) Histogram showing the difference in error for LFP and time models when compared to an ideal neuron. On average there was a significant decrease in error using the LFP model (p = 0.036, non-parametric sign-test) and using the LFP model reduced the error for a significant proportion of neurons (34 out of 55 tested, p = 0.0054, by randomization test). Black arrow indicates example neuron from Figure 3. (b) Average, normalized, firing rate of the population of neurons relative to the oscillating LFP signal. The firing rate is shown for trials when the target is in the neuron’s preferred direction (blue line) and clockwise to the preferred location (green line). The difference in firing rate reflects the allocation of attention into the neuron’s preferred location. Firing rate is binned over the LFP cycle instead of a more traditional static time window. The shift in firing rate reflecting the moving spotlight of attention is well regulated by the LFP-based windows: activity relating to the allocation of attention to the CW and Target locations are both isolated to a single cycle.
Figure 5
Figure 5
Correlation between the per-trial frequency of the 18–34 Hz filtered LFP signal and the animals’ reaction time to find the target. Trials were ordered and grouped by their observed LFP frequency. The average reaction time for each group is shown as a black circle, with the vertical line showing the standard error. A slower clocking frequency is correlated with an increased reaction time (ρ=−0.67, p = 1.6*10−3); linear fit is shown in red.

Similar articles

Cited by

References

    1. Armstrong KM, Moore T. Rapid enhancement of visual cortical response discriminability by microstimulation of the frontal eye field. Proc Natl Acad Sci U S A. 2007;104:9499–9504. - PMC - PubMed
    1. Barcelo F, Suwazono S, Knight RT. Prefrontal modulation of visual processing in humans. Nat Neurosci. 2000;3:399–403. - PubMed
    1. Bichot NP, Rossi AF, Desimone R. Parallel and serial neural mechanisms for visual search in macaque area V4. Science. 2005;308:529–534. - PubMed
    1. Bichot NP, Schall JD. Effects of similarity and history on neural mechanisms of visual selection. Nat Neurosci. 1999;2:549–554. - PubMed
    1. Bisley JW, Goldberg ME. Neuronal Activity in the Lateral Intraparietal Area and Spatial Attention. Science. 2003;299:81–86. - PubMed

Publication types