. 2009 Aug 12;17(8):1051-62.
doi: 10.1016/j.str.2009.06.015.

The CATH hierarchy revisited-structural divergence in domain superfamilies and the continuity of fold space

Affiliations

The CATH hierarchy revisited-structural divergence in domain superfamilies and the continuity of fold space

Alison Cuff et al. Structure. .

Abstract

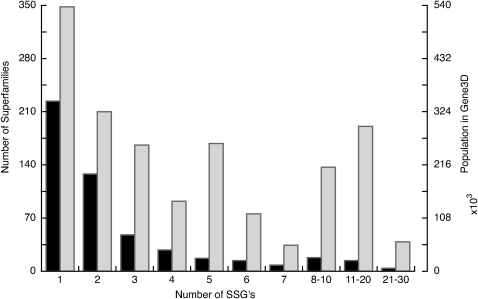
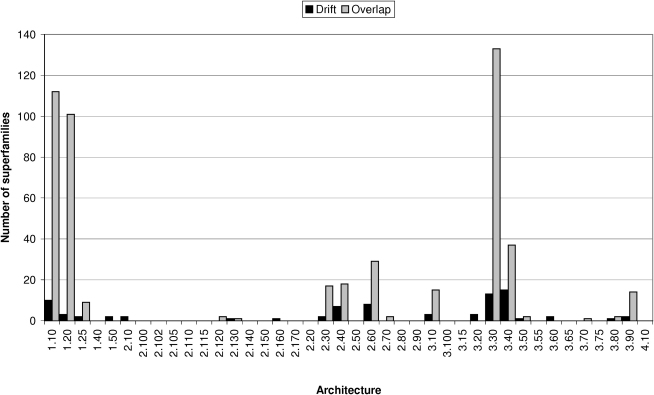
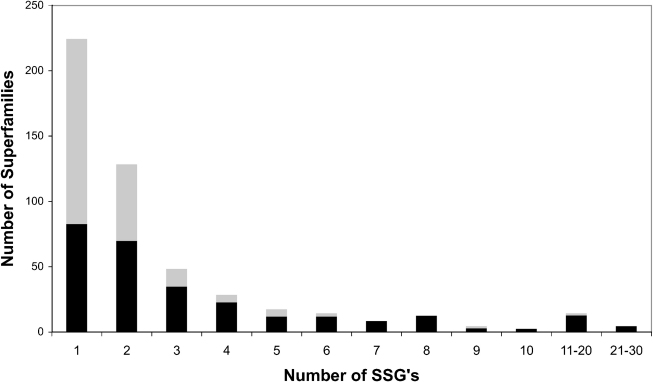
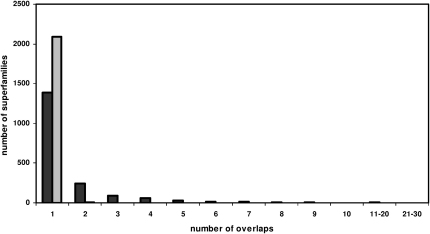
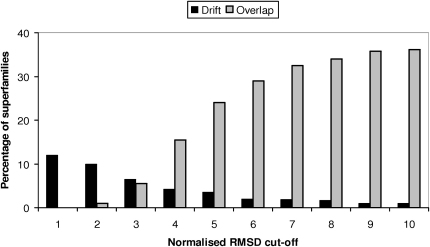
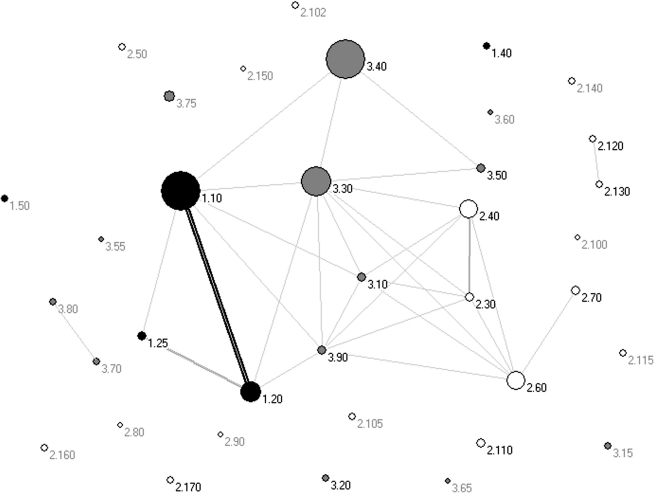
This paper explores the structural continuum in CATH and the extent to which superfamilies adopt distinct folds. Although most superfamilies are structurally conserved, in some of the most highly populated superfamilies (4% of all superfamilies) there is considerable structural divergence. While relatives share a similar fold in the evolutionary conserved core, diverse elaborations to this core can result in significant differences in the global structures. Applying similar protocols to examine the extent to which structural overlaps occur between different fold groups, it appears this effect is confined to just a few architectures and is largely due to small, recurring super-secondary motifs (e.g., alphabeta-motifs, alpha-hairpins). Although 24% of superfamilies overlap with superfamilies having different folds, only 14% of nonredundant structures in CATH are involved in overlaps. Nevertheless, the existence of these overlaps suggests that, in some regions of structure space, the fold universe should be seen as more continuous.


Figures

Figure 1
Figure 1
Relationship Between the Degree of Structural Diversity and Population of the Superfamilies in the Genomes Structural diversity was measured by the number of SSGs, shown as black bars (see Experimental Procedures). Gray bars indicate number of sequences.
Figure 2
Figure 2
Plot Showing the Number of Structurally Diverse Superfamilies and Overlapping Superfamilies in Each Architecture Structurally diverse superfamilies (shown in black) are defined as those superfamilies with 5 or more SSGs. Overlapping superfamilies are shown in gray. The architectures with the highest proportion of structurally diverse superfamilies are 3.40 (3 layer (αβα) sandwich), 3.30 (2 layer (αβ) sandwich), 2.60 (2 layer (ββ) sandwich), 1.10 (orthogonal bundle), and 2.40 (β barrel). The most overlapping architectures are 3.30 (2 layer (αβ) sandwich), 1.10 (orthogonal bundle), 1.20 (up-down bundle), 3.40 (40 (3 layer (αβα) sandwich), 2.60 (2 layer (ββ) sandwich), 2.40 (β barrel), and 2.30 (β roll). See Results for more details.
Figure 3
Figure 3
Structural Diversity of Two P-Loop Nucleotide Hydrolase Domains (A) Molscript pictures of the two P loop nucleotide hydrolase domains guanylate kinase (1kgdA01) and translocation atpase (1nktA01). Black indicates structural regions common to both domains, and gray indicates structural regions specific to a domain. The corresponding 2DSEC plot shows secondary structures (circle, α-helix; triangle, β strand) common to both domains (light gray) and specific secondary structures for a domain (dark gray). The size of the symbol reflects the number of residues in the secondary structure element. Following a superposition of these two domains, the “Consensus” plot highlights secondary structures common to both domains. The normalized RMSD calculated following the superposition of these domains is 14.5 Å. (B) Edge on view of the two domains shown in (A). (C) Foldspin plot showing structural diversity exhibited by selected relatives from the P loop hydolase superfamily (3.40.50.300). The “common structural core” between the central structure and other domains in the superfamily is shown in dark gray. The length of the spokes reflects the normalized RMSD measured for a particular relative superposed onto the central domain. Protein structure figures created using Molscript (Kraulis, 1991).
Figure 4
Figure 4
Relationship Between the Number of SSGs and Species Distribution The black regions represent the number of superfamilies that are universal to all species, whereas the gray regions represent all other superfamilies.
Figure 5
Figure 5
Correlation Between the Degree of Structural Diversity Across a Superfamily, Measured by the Number of SSGs and Population of the Superfamily, in Terms of Number of Sequences, in the Genomes (in Gene3D) The number of functions attributed to each superfamily is represented using symbols according to the number of FunCat categories.
Figure 6
Figure 6
The Number of Superfamilies Displaying the Number of Overlaps with Other Superfamilies Each overlap corresponds to one or more domains in the particular superfamily overlapping with one or more domains in another superfamily. The black (gray) bar corresponds to overlaps where the residue overlap threshold is 60% (80%).
Figure 7
Figure 7
Structural Overlap (in Black) Involving Two Domains, One Possessing a β-Roll the Other a β-Barrel Architecture Normalized RMSD = 2.95. Residue overlap is 65%. Figure created using Molscript (Kraulis, 1991).
Figure 8
Figure 8
GOSS Scores for Overlapping Domains in Different Folds Compared to All Domains in the Same Superfamily and Also all Domains in Different Folds GOSS scores are obtained by comparing functional annotations from the gene ontology (GO) according to semantic similarity (see Experimental Procedures). A GOSS score of 5 and above is highly indicative of functional similarity.
Figure 9
Figure 9
Plot Showing the Percentage of Superfamilies that Overlap (Gray) and Drift (>5 SSGs) (Black) for Different Normalized RMSD Cut-Offs
Figure 10
Figure 10
Network Plot Illustrating the Extent of Structural Overlap Between Different CATH Architectures Black, mainly α; white, mainly β; and gray. mixed α/β. Each point is labeled with its CATH architecture code in the form C.A. The thickness of the lines represents the number of overlapping superfamilies between the architectures. The size of the circles represents the number of sequence subfamilies (S35s, sequences clustered together at 35% sequence identity) in that architecture. Those architectures shown to overlap with at least one other in the CATH database are labeled as follows: 1.10 = α-orthogonal, 1.20 = α-up-down bundle, 1.25 = α-horseshoe, 2.30 = β-roll, 2.40 = β-barrel, 2.60 = β−sandwich, 2.70 = distorted β sandwich, 2.120 = β-6-propellor, 2.130 = β-7-propellor, 3.10 = αβ-roll, 3.30 = 2-layer αβ−sandwich, 3.40 = 3-layer(αβα) sandwich, 3.50 = 3-layer (ββα) sandwich, 3.70 = αβ-box, 3.80 = αβ-horseshoe, and 3.90 = αβ complex. Figure created using Pajek (http://vlado.fmf.uni-lj.si/pub/networks/pajek/sunbelt97/pajek.htm).

Similar articles

Cited by

References

    1. Ashburner M., Ball C.A., Blake J.A., Botstein D., Butler H., Cherry J.M., Davis A.P., Dolinski K., Dwight S.S., Eppig J.T. Gene ontology: tool for the unification of biology. The Gene Ontology Consortium. Nat. Genet. 2000;25:25–29. - PMC - PubMed
    1. Buchan D.W., Shepherd A.J., Lee D., Pearl F.M., Rison S.C., Thornton J.M., Orengo C.A. Gene3D: structural assignment for whole genes and genomes using the CATH domain structure database. Genome Res. 2002;12:503–514. - PMC - PubMed
    1. Chandonia J.M., Brenner S.E. Implications of structural genomics target selection strategies: Pfam5000, whole genome, and random approaches. Proteins. 2005;58:166–179. - PubMed
    1. Chothia C., Lesk A.M. The relation between the divergence of sequence and structure in proteins. EMBO J. 1986;5:823–826. - PMC - PubMed
    1. Dengler U., Siddiqui A.S., Barton G.J. Protein structural domains: analysis of the 3Dee domains database. Proteins. 2001;42:332–344. - PubMed

LinkOut - more resources