. 2010 Jun;223(2):377-84.
doi: 10.1016/j.expneurol.2009.07.032. Epub 2009 Aug 10.

Anti-inflammatory treatment in AD mice protects against neuronal pathology

Affiliations

Anti-inflammatory treatment in AD mice protects against neuronal pathology

Ji-Kyung Choi et al. Exp Neurol. 2010 Jun.

Abstract

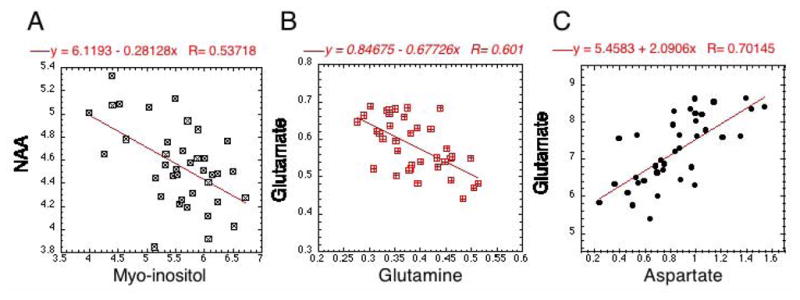
Prior studies suggest that non-steroidal anti-inflammatory drugs (NSAIDs) may lower the incidence of Alzheimer's disease (AD) and delay onset or slow progression of symptoms in mouse models of AD. We examined the effects of chronic NSAID treatment in order to determine which elements of the pathological features might be ameliorated. We compared the effects of the NSAIDs ibuprofen and celecoxib on immunohistological and neurochemical markers at two different ages in APPxPS1 mice using measurements of amyloid plaque deposition, Abeta peptide levels, and neurochemical profiles using magnetic resonance spectroscopy (MRS). At 6 months of age, few neurochemical changes were observed between PSAPP mice and WT mice using MRS. Ibuprofen, but not celecoxib, treatment significantly decreased the Abeta(42/40) ratio in frontal cortex at 6 months, but overall amyloid plaque burden was unchanged. Consistent with prior findings in mouse models, at 17 months of age, there was a decrease in the neuronal markers NAA and glutamate and an increase in the astrocytic markers glutamine and myo-inositol in AD mice compared to WT. Ibuprofen provided significant protection against NAA and glutamate loss. Neither of the drugs significantly affected myo-inositol or glutamine levels. Both ibuprofen and celecoxib lowered plaque burden without a significant effect on Abeta(1-42) levels. NAA levels significantly correlated with plaque burden. These results suggest that selective NSAIDs (ibuprofen and possibly celecoxib) treatment can protect against the neuronal pathology.


Figures

Figure 1
Figure 1
Representative pictures from 6 and 18 month old PSAPP mice. Front plane: the sections that are immunostained with Aβ1–40, back plane: sections stained with Aβ1–42. Three 50 μm sections per brain were used for quantification of plaque burden: most anterior section was at the bregma level (anterior commissure) and 0.3 and 0.6 mm posterior to bregma covering approximately 0.6 mm thickness. This area is comparable to the cortex that we dissected out for in vitro MRS and ELISA for neurochemical profiling and Aβ measurements.
Figure 2
Figure 2
Effects of NSAID treatments on Aβ and plaque levels. A) Plaque burden (expressed as a fraction or cortical areas) at 16–18 months measured as a function of NSAID treatment. Both celecoxib and ibuprofen were significantly different from intreated animals. B) Effects of NSAID treatment on Aβ as measured using ELISA – there were no effects of treatment.
Figure 3
Figure 3
Effects of NSAID treatment on MRS measures. A) Plots of the effects of NSAID treatment on NAA, glutamate, glutamine and myo-inositol. B) Effects of NSAID treatment on NAA measured in vivo. C) Typical in vitro MRS spectrum in WT and AD regular diet mice at 18 months of age. * - p<0.05 by ANOVA.
Figure 4
Figure 4
ROC curves for classification of metabolite ratios. A) Ratios constructed using NAA/myo-inositol; NAA*glt/myo-inositol*gln or gln/glt. All the ratios were significantly different in AD and WT mice. B) On the right is shown a receiver operator characteristic curve for three difference metrics used to characterize the mice as AD or non-AD. The area under the curves are significantly different for myo*gln/NAA*glt vs. NAA vs. gln; thus showing the ability to characterize the animals better using the combined ratio metrics. The ratio of myo*gln/NAA*glt was not significantly better than myo/NAA (not shown).
Figure 5
Figure 5
Classification of groups using linear discriminant analysis. A) Classification of groups using just the plaque areas and ELISA Ab 40+42 values. Using holdout analysis indicated 48% correct classification. B) Classification using five MRS chemicals (NAA, glt, gln, myo-inostiol, alanine). There was 69% correct classification. Alanine adds significant power to discriminate between NSAID treated and untreated. C) Linear discriminant analysis of the transgenic AD mice combining the MRS and histopathology data. The variables included were: myo-inositol, glutamine, glutamate, NAA, alanine (MRS), Aβ. 40 and Aβ42 levels using ELISA and the plaque burden expressed as the fraction of cortical area. There was excellent separation between the three different treatment groups (Wilk’s lambda for functions 1 and 2 was 0.077 and 0.334 respectively; p < 0.001). All the discriminant plots are normalized to one standard deviation.
Figure 6
Figure 6
Correlations between NAA and plaque areas for all animals except WT. A) Plot of the plaque area as a fraction of cortex vs. NAA from the in vitro data. There is a weak but significant correlation that seems to have a threshold at around 5% plaque area. B) Plot of plaque area as a fraction of cortex vs. NAA from the in vivo data. The correlation is also significant.
Figure 7
Figure 7
Relations between MRS markers for all animals. A) Plot of NAA vs. myo-inostiol –there is a weak but significant inverse correlation. B) Plot of glutamate vs. glutamine, again showing an inverse correlation. C) Plot of glutamate vs. aspartate. There is a postitive correlation.

References

    1. Brand A, Richter-Landsberg C, Leibfritz D. Multinuclear NMR studies on the energy metabolism of glial and neuronal cells. Dev Neurosci. 1993;15:289–298. - PubMed
    1. Choi JK, Dedeoglu A, Jenkins BG. Application of MRS to mouse models of neurodegenerative illness. NMR Biomed. 2007;20:216–237. - PubMed
    1. Dedeoglu A, Choi JK, Cormier K, Kowall NW, Jenkins BG. Magnetic resonance spectroscopic analysis of Alzheimer’s disease mouse brain that express mutant human APP shows altered neurochemical profile. Brain Res. 2004;1012:60–65. - PubMed
    1. Hsiao K, Chapman P, Nilsen S, Eckman C, Harigaya Y, Younkin S, Yang F, Cole G. Correlative memory deficits, Abeta elevation, and amyloid plaques in transgenic mice. Science. 1996;274:99–102. - PubMed
    1. in t’ Veld BA, Ruitenberg A, Hofman A, Launer LJ, van Duijn CM, Stijnen T, Breteler MM, Stricker BH. Nonsteroidal antiinflammatory drugs and the risk of Alzheimer’s disease. N Engl J Med. 2001;345:1515–1521. - PubMed

Publication types

MeSH terms