. 2009 Nov;220(1):90-108.
doi: 10.1016/j.expneurol.2009.07.034. Epub 2009 Aug 10.

Volumetric effects of motor cortex injury on recovery of dexterous movements

Affiliations

Volumetric effects of motor cortex injury on recovery of dexterous movements

Warren G Darling et al. Exp Neurol. 2009 Nov.

Erratum in

Abstract

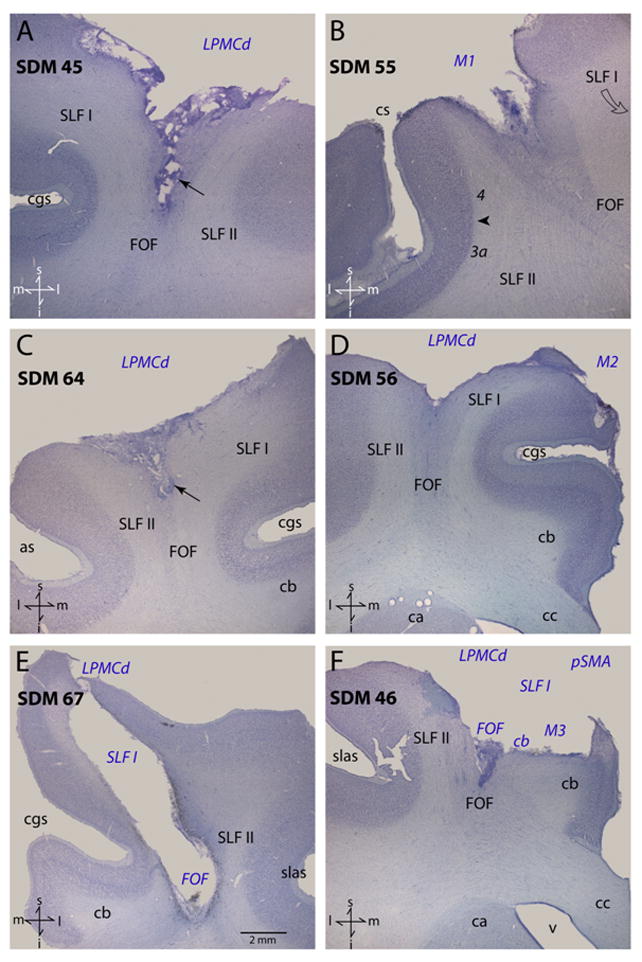
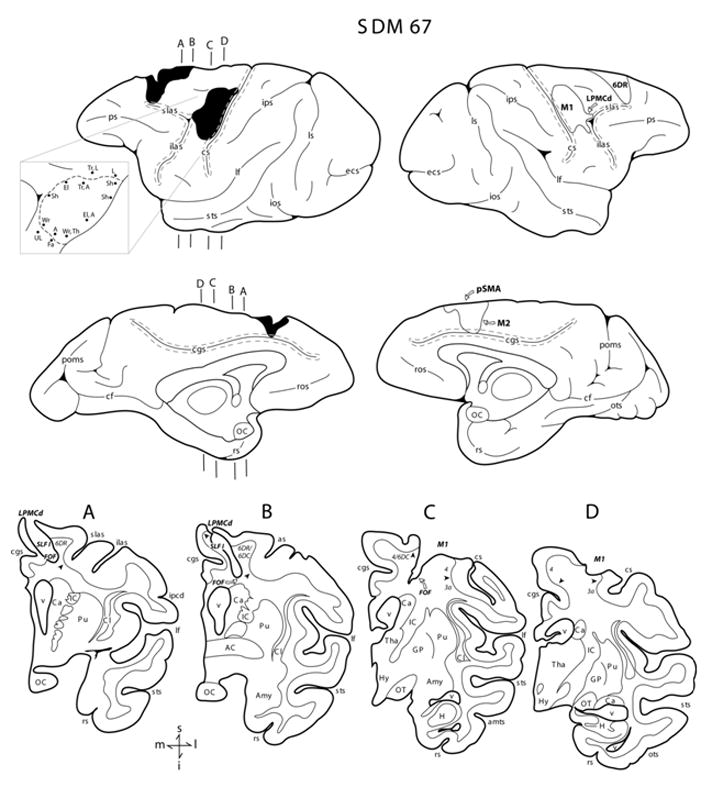
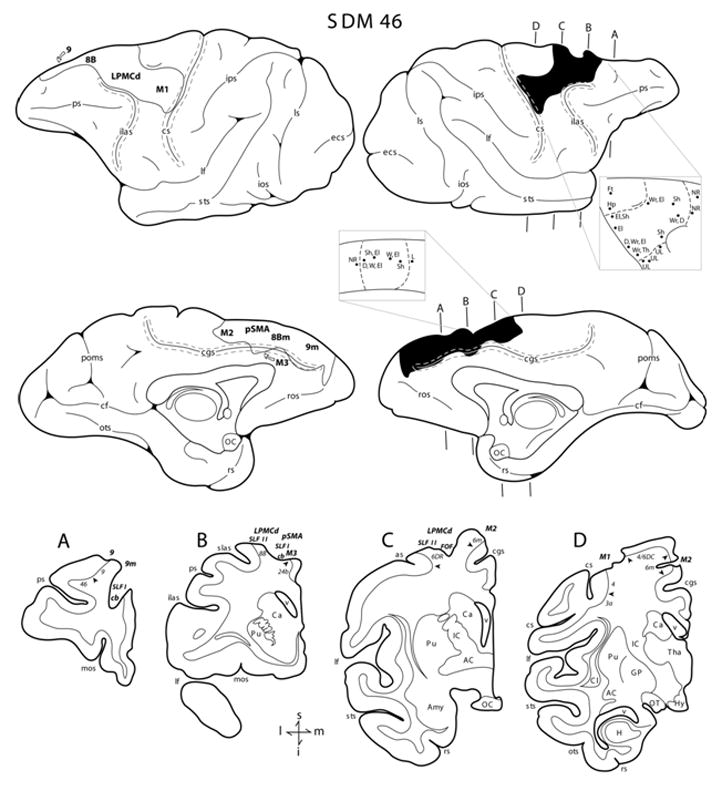
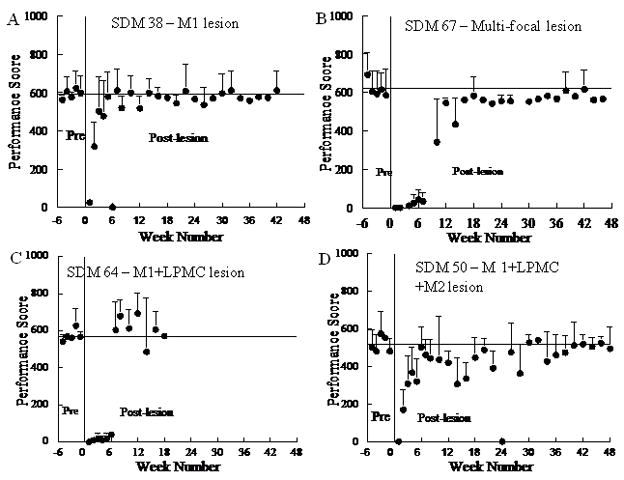
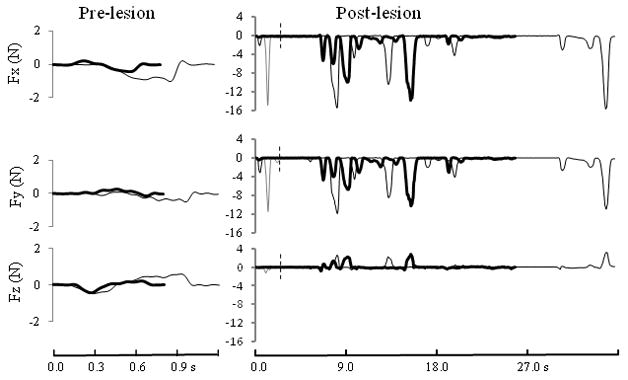
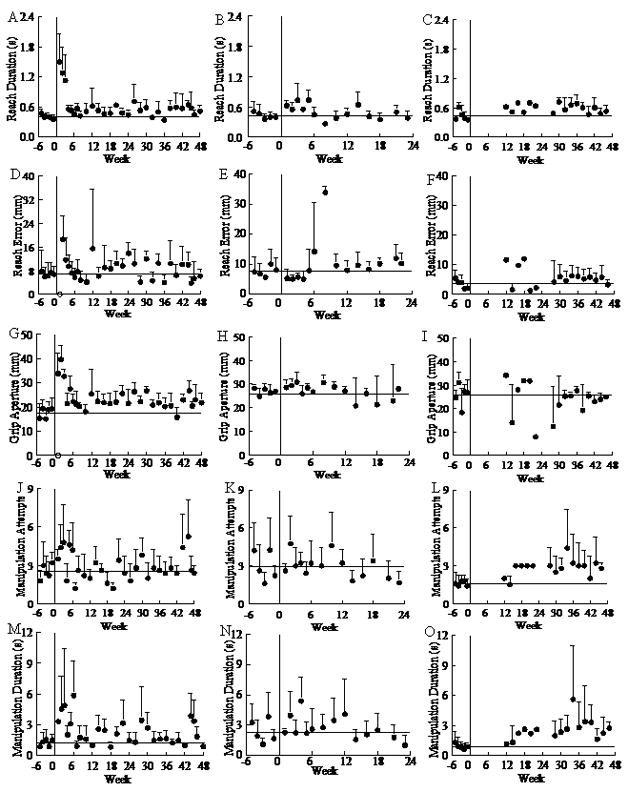
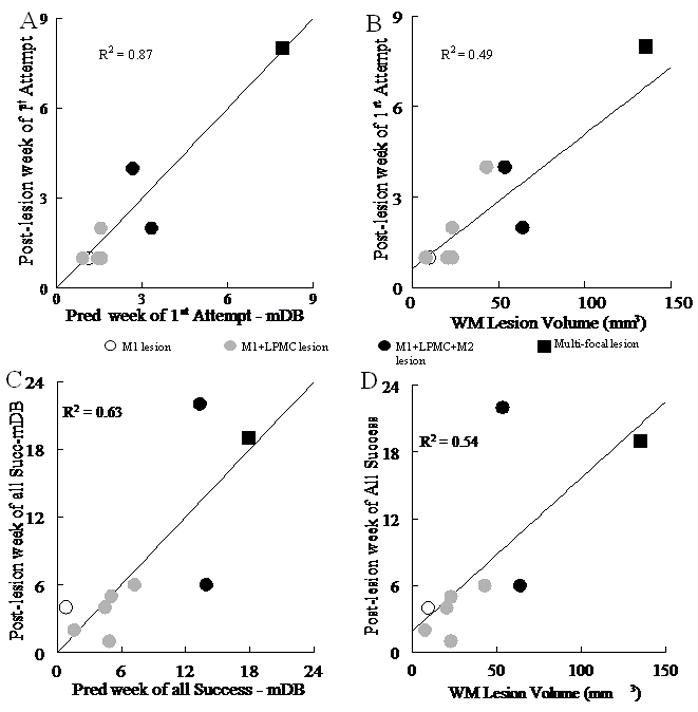
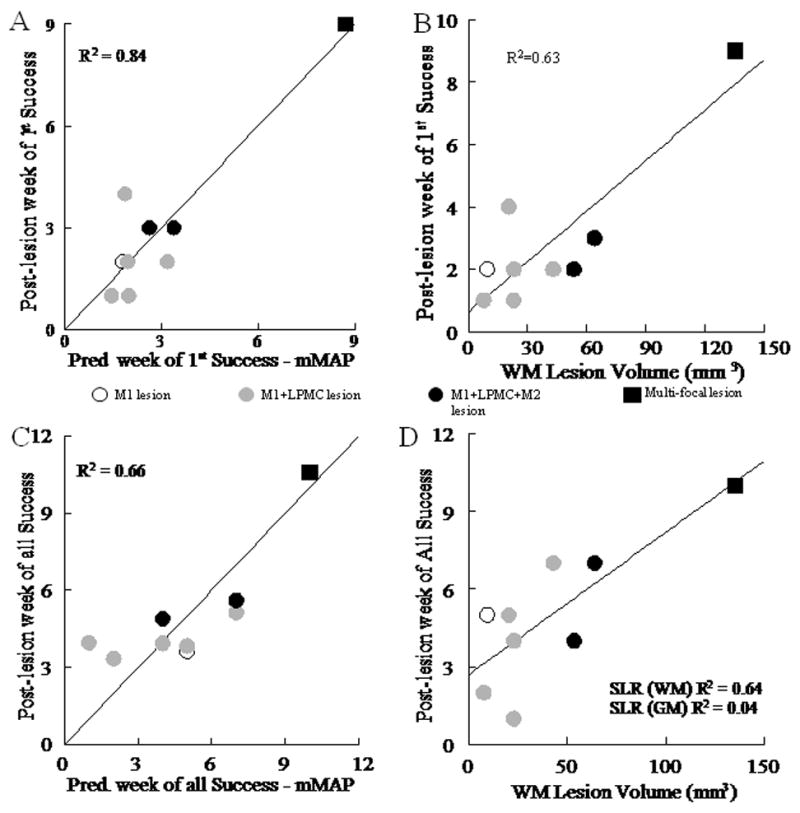
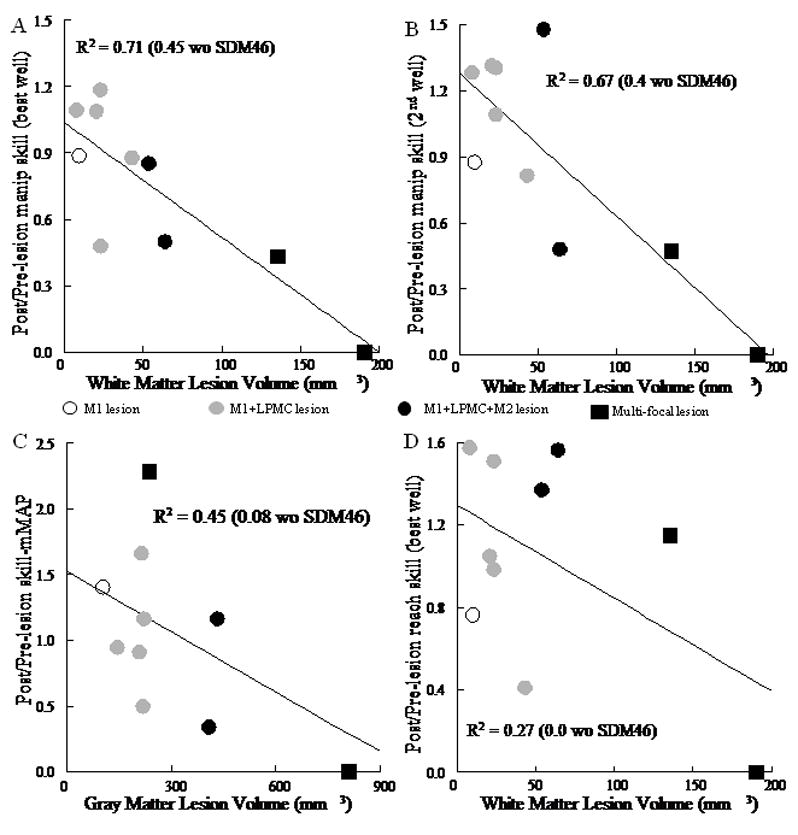
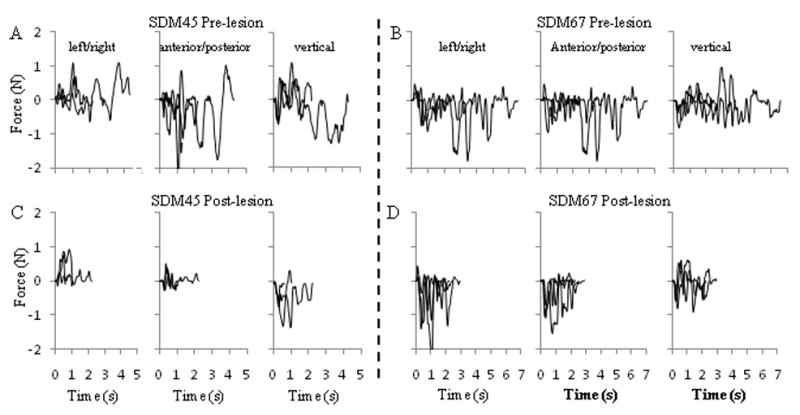
Due to the heterogeneous nature of most brain injuries, the contributions of gray and white matter involvement to motor deficits and recovery potential remain obscure. We tested the hypothesis that duration of hand motor impairment and recovery of skilled arm and hand motor function depends on the volume of gray and white matter damage of the frontal lobe. Lesions of the primary motor cortex (M1), M1 + lateral premotor cortex (LPMC), M1 + LPMC + supplementary motor cortex (M2) or multifocal lesions affecting motor areas and medial prefrontal cortex were evaluated in rhesus monkeys. Fine hand motor function was quantitatively assessed pre-lesion and for 3-12 months post-lesion using two motor tests. White and gray matter lesion volumes were determined using histological and quantitative methods. Regression analyses showed that duration of fine hand motor impairment was strongly correlated (R(2)>0.8) with the volume of gray and white matter lesions, with white matter lesion volume being the primary predictor of impairment duration. Level of recovery of fine hand motor skill was also well correlated (R(2)>0.5) with gray and white matter lesion volume. In some monkeys post-lesion skill exceeded pre-lesion skill in one or both motor tasks demonstrating that continued post-injury task practice can improve motor performance after localized loss of frontal motor cortex. These findings will assist in interpreting acute motor deficits, predicting the time course and expected level of functional recovery, and designing therapeutic strategies in patients with localized frontal lobe injury or neurosurgical resection.


Figures

Figure 1
Figure 1
Plate of photomicrographs illustrating Nissl-stained coronal sections through representative cases analyzed in this study. In each panel the region of extirpated cortex and involved subcortical pathways are identified by the blue italicized conventions. The arrows in panels A and C identify the tapered portion of the subcortical lesion that part the adjacent SLF I and SLF II. The arrow head in panel B identifies the boundary between Brodmann’s areas 4 and 3a. The scale bar in panel E corresponds to all panels. Directional orientation is indicated in the lower left corner of each panel with abbreviated directions: superior (s), inferior (i), medial (m) and lateral (l). Abbreviations: as, spur of the arcuate sulcus; ca, caudate nucleus; cb, cingulum bundle; cc, corpus callosum; cgs, cingulate sulcus; cs, central sulcus; FOF, fronto-occipital fasciculus; i, inferior; l, lateral; LPMCd, dorsal lateral premotor cortex; m, medial; M1, primary motor cortex; M2, supplementary motor cortex; pSMA, pre-supplementary motor cortex; s, superior; slas, superior limb of the arcuate sulcus; SLF I, superior longitudinal fasciculus I; SLF II, superior longitudinal fasciculus II; v ventricle.
Figure 2
Figure 2
Line drawings of the lateral and medial surfaces of the hemisphere in case SDM67. Representative coronal sections through the lesioned hemisphere are shown below the medial surfaces. The left hemisphere illustrates the location of the cortical lesion (blackened area) which extended onto the medial wall to the pre-supplementary motor cortex (pSMA) and the rostral portion of M2 and the right hemisphere shows the location of the superimposed lesion (outlined area) that was used to calculate the respective gray and white matter lesion volumes. Coronal panels A through D are through the lesion site in the left hemisphere. In each coronal section, the region of lesioned cortex and involved subcortical pathways are identified by the bold italicized conventions. Pertinent Brodmann’s areas are indicated on the coronal sections immediately below the gray matter and the respective boundaries are identified by the arrow heads. The pullout on the left hemisphere illustrates the microstimulation map. On the map each black dot represents a stimulation point with the affiliated movement(s) observed following stimulation. Abbreviations: A, arm; ac, anterior commissure; amts, anterior medial temporal sulcus; Amy, amygdala; Ca, caudate nucleus; cf, calcarine fissure; cgs, cingulate sulcus; Cl, claustrum; cs, central sulcus; ecs, ectocalcarine sulcus; El, elbow; Fa, face; GP, globus pallidus; H, hippocampus; hy, hypothalamus; IC, internal capsule; ilas, inferior limb of the arcuate sulcus; ios, inferior occipital sulcus; ipcd, inferior precentral dimple; ips, intraparietal sulcus; L, leg; lf, lateral fissure; ls, lunate sulcus; OC, optic chiasm; OT, optic tract; ots, occipito-temporal sulcus; poms, medial parieto-occipital sulcus; ps, principle sulcus; Pu, putamen; rs, rhinal sulcus; ros, rostral sulcus; Sh, shoulder; slas, superior limb of the arcuate sulcus; sts, superior temporal sulcus; Th, thumb; Tha, thalamus; To, tongue; Tr, trunk; UL, upper lip; v ventricle; Wr, wrist. For other abbreviations see Figure 1.
Figure 3
Figure 3
Line drawings of the lateral and medial surfaces of the hemisphere in case SDM46. Representative coronal sections through the lesioned hemisphere are shown below the medial surfaces. The right hemisphere illustrates the location of the cortical lesion (blackened area) which extended onto the medial wall to the pre-supplementary motor cortex (pSMA), the rostral portion of M2 and prefrontal region (areas 8Bm and 9m). The right hemisphere shows the location of the superimposed lesion (outlined area) that was used to calculate the respective gray and white matter lesion volumes. Coronal panels A through D are through the lesion site in the right hemisphere. In each coronal section, the region of lesioned cortex and involved subcortical pathways are identified by the bold italicized conventions. Pertinent Brodmann’s areas are indicated on the coronal sections immediately below the gray matter and the respective boundaries are identified by the arrow heads. The pullout on the right hemisphere illustrated the microstimulation map. On the map each black dot represents a stimulation point with the affiliated movement(s) observed following stimulation. Abbreviations: D, digit; Ft, foot; Hp, hip; M3, rostral cingulate motor cortex; mos, medial orbital sulcus; NR, no response. For other abbreviations see Figures 1 and 2.
Figure 4
Figure 4
Pre and post-lesion performance scores on the mMAP curved rod task for 4 monkeys. The solid vertical line shows the time of the surgically induced lesion. The solid horizontal line shows average performance scores for the last 5 pre-lesion tests. Each plotted point is the mean performance score for 5 trials. Error bars are 1 s.d.
Figure 5
Figure 5
Forces exerted in the left/right (Fx), anterior-posterior (Fy) and vertical (Fz) directions during retrieval of a carrot chip in the mMAP straight rod task by SDM46. On the left side are shown data from two successful pre-lesion trials that had the best (black line) and worst (gray line) performance scores in the last 5 testing sessions. On the right side are shown the first post-lesion attempt (thin light gray line ending at vertical dashed line), highest post-lesion impulse (thin dark gray line) and the only post-lesion successful trial in this task (thick black line). Note that the forces exerted even in the first post-lesion attempt were much larger than those exerted during successful pre-lesion trials.
Figure 6
Figure 6
Pre- and post-lesion performance on individual components of the mDB task for SDM38 (left side – A, D, G, J, M) on well D, SDM45 (middle – B, E, H, K, N) on well A and SDM67 (right side – C, F, I, L, O) on well B. Each symbol on a graph shows the mean performance on individual test sessions for one component of the mDB performance score for one monkey. Error bars are 1 S.D.
Figure 7
Figure 7
Recovery on the mDB task. A and B show post-lesion week of 1st attempt (on the best well - with highest pre-lesion skill) plotted against: predicted week of first attempt from gray and white matter lesion volumes by multiple linear regression (A) and white matter (WM) lesion volume by single linear regression (B). Post-lesion week of all successes (on the best well) is plotted against predicted week of all successes from gray and white matter lesions by multiple linear regression (C) and white matter lesion volume by single linear regression (SLR) (D). Each plotted point is data from a single monkey with type of lesion indicated by the symbol (see legend in center of figure). Coefficients of determination for the plotted relationships (p < 0.005) and for gray matter volume (D) are shown.
Figure 8
Figure 8
Recovery on the mMAP task. Post-lesion week of first success on the mMAP curved rod task is plotted against: the predicted week of first success from gray and white matter lesion volume by multiple linear regression (A) and white matter (WM) lesion volume by single linear regression (B). Post-lesion week of all successes on the mMAP curved rod task is plotted against: predicted week of all successes from gray and white matter lesion volume (C) by multiple linear regression and white matter lesion volume by single linear regression (SLR - D). Each plotted point is data from a single monkey with type of lesion indicated by the symbol (see legend on figure). Coefficients of determination for the plotted relationships (p < 0.005) and for gray matter volume (D) are shown.
Figure 9
Figure 9
Recovery of skill on the mDB and mMAP tasks. Each plotted point shows the ratio of post-lesion to pre-lesion manipulation skill for a single monkey plotted against white matter lesion volume for the mDB (best well) task (A) and mDB (2nd well) task (B). Recovery of skill on the mMAP curved rod task is plotted against gray matter lesion volume in C. In D the ratio of post-lesion to pre-lesion reach skill is plotted against white matter lesion volume. Each plotted point is data from a single monkey with type of lesion indicated by the symbol (see legend on figure). Coefficients of determination for the plotted relationships are shown (p < 0.05).
Figure 10
Figure 10
Force vs. time records for SDM45 (A, C) and SDM67 (B, D) in the mMAP curved rod task. Each graph contains force records in X (left/right), Y (anterior-posterior) or Z (vertical) directions from 3 trials (with short, medium, long durations) within a single testing session pre-lesion (one of the final 5 pre-lesion testing sessions – top row) and post-lesion (10 weeks post-lesion for SDM45, 20 weeks post-lesion for SDM67 – bottom row). Records were aligned to time of first contact for each trial. Note the generally shorter durations and lower forces (especially anterior-posterior forces for SDM45 and vertical forces for SDM67) in the post-lesion trials.

References

    1. Alaverdashvili M, Moon SK, Beckman CD, Virag A, Whishaw IQ. Acute but not chronic differences in skilled reaching for food following motor cortex devascularization vs. photothrombotic stroke in the rat. Neuroscience. 2008;157:297–308. - PubMed
    1. Battaglini PP, Muzur A, Galletti C, Skrap M, Brovelli A, Fattori P. Effects of lesions to area V6A in monkeys. Exp Brain Res. 2002;144:419–422. - PubMed
    1. Binkofski F, Seitz RJ, Hacklander T, Pawelec D, Mau J, Freund HJ. Recovery of motor functions following hemiparetic stroke: a clinical and magnetic resonance-morphometric study. Cerebrovasc Dis. 2001;11:273–281. - PubMed
    1. Black P, Cianci SN, Markowitz RS. Differential recovery of proximal and distal motor power after cortical lesions. Trans Am Neurol Assoc. 1971;96:173–177. - PubMed
    1. Bucy PC. Organization of the central nervous control of muscular activity. Bull Chic Med Soc. 1949;51:863–866. - PubMed

Publication types

MeSH terms