. 2009 Dec 1;164(2):849-61.
doi: 10.1016/j.neuroscience.2009.08.013. Epub 2009 Aug 11.

Brown adipose tissue thermogenesis heats brain and body as part of the brain-coordinated ultradian basic rest-activity cycle

Affiliations

Brown adipose tissue thermogenesis heats brain and body as part of the brain-coordinated ultradian basic rest-activity cycle

Y Ootsuka et al. Neuroscience. .

Abstract

Brown adipose tissue (BAT), body and brain temperatures, as well as behavioral activity, arterial pressure and heart rate, increase episodically during the waking (dark) phase of the circadian cycle in rats. Phase-linking of combinations of these ultradian (<24 h) events has previously been noted, but no synthesis of their overall interrelationships has emerged. We hypothesized that they are coordinated by brain central command, and that BAT thermogenesis, itself controlled by the brain, contributes to increases in brain and body temperature. We used chronically implanted instruments to measure combinations of bat, brain and body temperatures, behavioral activity, tail artery blood flow, and arterial pressure and heart rate, in conscious freely moving Sprague-Dawley rats during the 12-h dark active period. Ambient temperature was kept constant for any particular 24-h day, varying between 22 and 27 degrees C on different days. Increases in BAT temperature (> or = 0.5 degrees C) occurred in an irregular episodic manner every 94+/-43 min (mean+/-SD). Varying the temperature over a wider range (18-30 degrees C) on different days did not change the periodicity, and neither body nor brain temperature fell before BAT temperature episodic increases. These increases are thus unlikely to reflect thermoregulatory homeostasis. Episodic BAT thermogenesis still occurred in food-deprived rats. Behavioral activity, arterial pressure (18+/-5 mmHg every 98+/-49 min) and heart rate (86+/-31 beats/min) increased approximately 3 min before each increase in BAT temperature. Increases in BAT temperature (1.1+/-0.4 degrees C) were larger than corresponding increases in brain (0.8+/-0.4 degrees C) and body (0.6+/-0.3 degrees C) temperature and the BAT episodes commenced 2-3 min before body and brain episodes, suggesting that BAT thermogenesis warms body and brain. Hippocampal 5-8 Hz theta rhythm, indicating active engagement with the environment, increased before the behavioral and autonomic events, suggesting coordination by brain central command as part of the 1-2 h ultradian basic rest-activity cycle (BRAC) proposed by Kleitman.


Figures
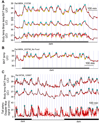
Figure 1
Figure 1
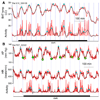
A. BAT temperature (top red trace) and brain temperature (middle red trace) and body temperature (bottom red trace) records in one rat. Ambient temperature 23°C. B. BAT temperature (red trace) record in one rat without access to food for 12 hours before the dark period and for 12 hours during the dark period. Ambient temperature 24°C. C. BAT temperature (top red trace), body temperature (middle red trace) and tail artery Doppler blood flow signal (bottom red trace) records in one rat. Ambient temperature 26°C. All original records are 1 min averages. Thicker black lines were fitted by the DWT wavelet function. Blue-filled and yellow-filled black circles indicate peak and onset times. Black bars represent dark lights-off time. The beginning and end portions of the records in A and B, and the middle portion in C are from the lights-on time, and both circadian and ultradian periodicities are evident. Only dark (lights-off portions) of the records are analysed in our paper.
Figure 2
Figure 2
A, B. Frequency distributions of time between peak of episodic increases in BAT temperature at threshold amplitude 0.5°C, and of amplitudes of the peaks at this threshold. C. Frequency distributions of peak intervals at threshold amplitude 1.0°C. D. BAT peak intervals (mean±SD) with threshold amplitudes increasing in 0.05°C steps from 0.50 to 1.0°C. Linear regression between threshold amplitude and peak intervals for all dark period peaks in all rats at ambient temperature 22–27°C was significant (F1,4295 = 161.6, P<0.0001), but the relationship was not strong (R2=0.04).
Figure 3
Figure 3
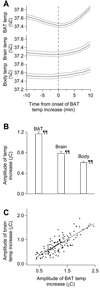
A. Body and brain temperatures for the 10 min periods before and after the onset time of ultradian episodes in BAT temperature (mean±SE of 121 episodes). B. Amplitudes (mean±SE) of BAT, brain and body temperature increases during the dark period; ambient temperature 22–27°C. ¶¶ each mean is significantly different from the other two (repeated measures F2,182 = 208.9, P<0.0001). C. Linear regression between amplitudes of corresponding increases in BAT and brain temperature (regression F1,190 = 224.8, P<0.0001, R2=0.54).
Figure 4
Figure 4
A. Brown adipose tissue (BAT) temperature (top red trace) and behavioral activity (bottom red trace) recorded every 2.5 min in an individual rat. Ambient temperature 24°C. B. Mean AP (top red trace), HR (middle red trace) and behavioral activity (bottom red trace) recorded every 1 min in an individual rat. Ambient temperature 24°C. Blue-filled and yellow-filled circles indicate peak and onset times, respectively. The yellow-filled and green-filled black circles on the AP (top) trace in B indicate peak onset times and peak end times respectively. Coincident end and onset times are shown as yellow circles overlapping the green circles. The black lines were fitted by the DWT function.
Figure 5
Figure 5
Frequency distributions of peak intervals (A) and amplitudes (B) of episodic increases in AP (threshold amplitude 10 mm Hg).
Figure 6
Figure 6
A. Left axis and Z axis: hippocampal EEG power spectra (Fourier transformation of raw EEG signal, magnitude-squared, 10.24 s epochs, 1 min bins), color coded (log scale) as in inset at top right. Right axis, upper trace: BAT temperature (means of 1 min bins). Right axis, lower trace: Percentage of hippocampal EEG power in 5–8 Hz theta band in relation to total power (1 min bins). B. EEG theta power proportion (percent of total power) and BAT temperature (left blue and right red axes respectively) for the period 20 min before and 40 min after the onset of an ultradian increase in BAT temperature (1 min bins). The inset shows the result of cross correlation of the EEG and BAT signals (see text). C. Group data (mean±SE) for percentage of 5–8 Hz theta EEG power (blue left vertical axis) from the same dark period segments as shown for the BAT temperature (red right vertical axis) obtained from 60 min dark period segments, each commencing 20 min before an ultradian episode of BAT thermogenesis, marked by the vertical line (1 min bins). Data from 45 segments in 8 rats. The increase in EEG theta power commences approximately 5 min before the BAT temperature signal starts to increase.
Figure 7
Figure 7
Neutral red stain of a coronal brain section showing a typical location of the EEG recording electrode in the hippocampal CA1 area (arrow).

References

    1. Alfödi P, Rubicsek G, Cserni G, Obal F., Jr Brain and core temperatures and peripheral vasomotion during sleep and wakefulness at various ambient temperatures in the rat. Pflugers Arch. 1990;417:336–341. - PubMed
    1. Aschoff J, Pohl H. Rhythmic variations in energy metabolism. Fed Proc. 1970;29:1541–1552. - PubMed
    1. Bailey D, Harry D, Johnson RE, Kupprat I. Oscillations in oxygen consumption of man at rest. J Appl Physiol. 1973;34:467–470. - PubMed
    1. Baker F, Angara C, Szymusiak R, McGinty D. Persistence of sleep-temperature coupling after suprachiasmatic nuclei lesions in rats. Am J Physiol. 2005;289:R827–R838. - PubMed
    1. Baker M, Hayward J. Autonomic basis for the rise in brain temperature during paradoxical sleep. Science (New York, NY) 1967;157:1586–1588. - PubMed

Publication types

MeSH terms