. 2009 Aug 14;325(5942):866-70.
doi: 10.1126/science.1174443.

The transcriptional repressor DEC2 regulates sleep length in mammals

Affiliations

The transcriptional repressor DEC2 regulates sleep length in mammals

Ying He et al. Science. .

Abstract

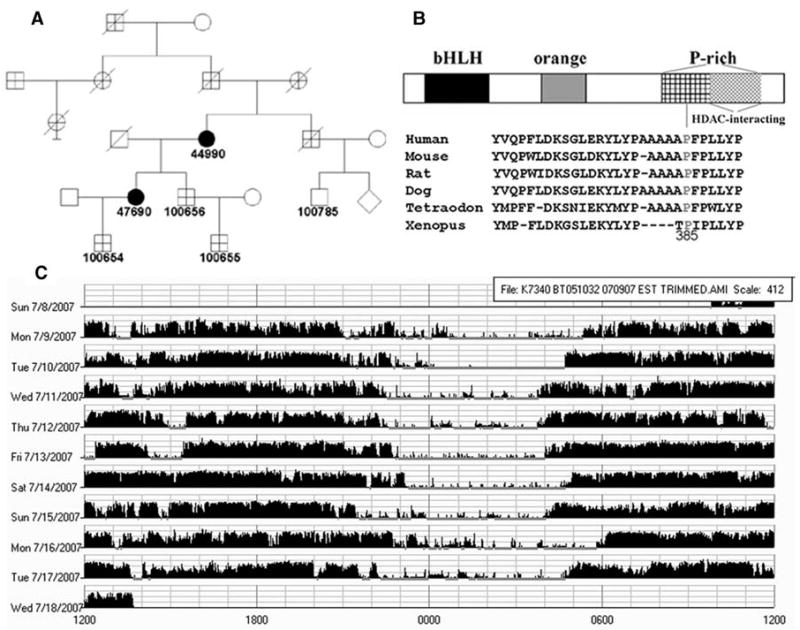
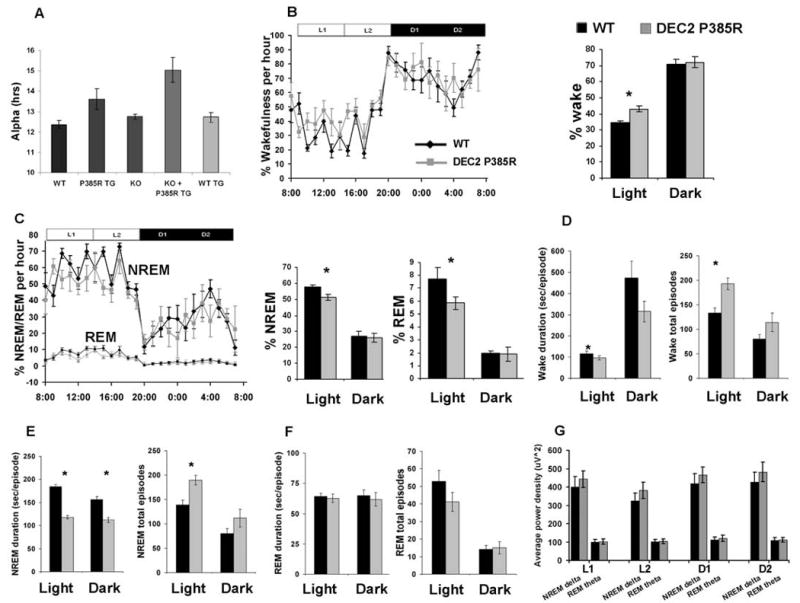
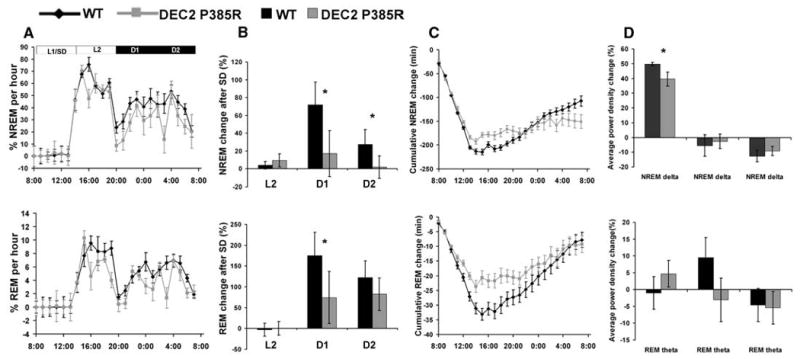
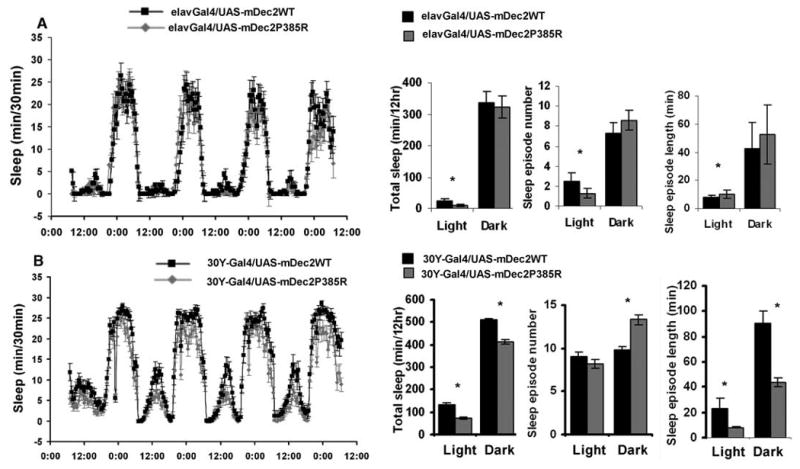
Sleep deprivation can impair human health and performance. Habitual total sleep time and homeostatic sleep response to sleep deprivation are quantitative traits in humans. Genetic loci for these traits have been identified in model organisms, but none of these potential animal models have a corresponding human genotype and phenotype. We have identified a mutation in a transcriptional repressor (hDEC2-P385R) that is associated with a human short sleep phenotype. Activity profiles and sleep recordings of transgenic mice carrying this mutation showed increased vigilance time and less sleep time than control mice in a zeitgeber time- and sleep deprivation-dependent manner. These mice represent a model of human sleep homeostasis that provides an opportunity to probe the effect of sleep on human physical and mental health.


Figures

Fig. 1
Fig. 1
A DEC2 point mutation was identified in a short sleep family. (A) Pedigree of K7430 family carrying DEC2 mutation (P385R). (B) P385 is localized in the C-terminal proline-rich domain and its flanking sequences are highly conserved among mammalian DEC2 orthologs. (C) Activity recording by wrist actigraphy for one mutation carrier demonstrates the extended active period each day.
Fig. 2
Fig. 2
Baseline sleep-wake characterizations of DEC2-P385R and WT littermate mice. (A) Duration of the active phase (α) for mice of the indicated genotype. (B) Percentage of time in a wakeful state was significantly increased in DEC2-P385R (n = 5) compared with their WT littermates (n = 8), especially in light phase (ZT 0–12, ZT 0 = 8 A.M.). Horizontal bar indicates light and dark phases. L1, ZT 0–6; L2, ZT 6–12; D1, ZT 12–18; D2, ZT 18–24. (C) Percentage of time spent in NREM and REM during the light phase was shortened in DEC2-P385R mice. Comparisons of mean duration time and episode number of wakefulness (D), NREM (E), and REM (F) for DEC2-P385R (gray bar) and WT littermates (dark bar). (G) Average spectral power was calculated for each of the 6-hour periods (from left to right: L1, L2, D1, and D2) as indicated by the horizontal bar in (B). NREM delta and REM theta power were compared for the two genotypes. Significant differences were marked with asterisks. P < 0.05, by one-tailed and two-tailed Student's t test. All data are expressed as means ± SEM. Error bars represent SEM.
Fig. 3
Fig. 3
Altered sleep regulation in DEC2-P385R mice. Data for NREM sleep are shown in top panels and for REM sleep are shown in bottom panels. (A) Time course of NREM and REM sleep as percentage of time spent every hour during and after sleep deprivation for one day. (B) Percentage changes of time after sleep deprivation in comparison with the baseline condition for NREM and REM in L2, D1, and D2 for DEC2-P385R and WT mice. (C) Cumulative NREM and REM sleep loss and gain compared with baseline conditions for the sleep deprivation experiment. (D) Analysis of spectral sleep power changes compared with baseline conditions for L2, D1, and D2. Significant differences are marked with asterisks. P < 0.05, by one-tailed and two-tailed Student's t test. Error bars represent SEM.
Fig. 4
Fig. 4
Characterization of sleeplike behavior in transgenic flies overexpressing WT (black) or P385 (gray) mDec2 with elav-GAL4 (A) or 30Y-GAL4 (B) drivers. Profile of daily sleep-like behavior (amount of sleep during each 30-min period), total sleep time, sleep episode number, and mean sleep episode length in the light and dark periods of the day were plotted. Significant differences by one-tailed Student's t test are marked with asterisks (P < 0.05). Error bars represent SEM.

Comment in

References

    1. Fuller PM, Gooley JJ, Saper CB. J Biol Rhythms. 2006;21:482. - PubMed
    1. Saper CB, Chou TC, Scammell TE. Trends Neurosci. 2001;24:726. - PubMed
    1. Pace-Schott EF, Hobson JA. Nat Rev Neurosci. 2002;3:591. - PubMed
    1. Durmer JS, Dinges DF. Semin Neurol. 2005;25:117. - PubMed
    1. Knutson KL, Van Cauter E. Ann N Y Acad Sci. 2008;1129:287. - PMC - PubMed

Publication types

MeSH terms

Substances