

Repeatability of pattern electroretinogram measurements using a new paradigm optimized for glaucoma detection
- PMID: 19680050
- PMCID: PMC2727663
- DOI: 10.1097/IJG.0b013e31818c6f44
Repeatability of pattern electroretinogram measurements using a new paradigm optimized for glaucoma detection
Abstract
Purpose: To determine the within-trial and between-trial repeatability of pattern electroretinogram (PERG) measurements in healthy and patient eyes, using a new clinical instrument, the PERGLA.
Study design: In all, 70 eyes of 35 healthy individuals (intraocular pressure <22 mm Hg, healthy optic disc by stereophotograph assessment, standard visual fields within normal limits) and 90 eyes of 45 clinic patients (ocular hypertensive, glaucomatous optic neuropathy by stereophotograph assessment and/or repeatable abnormal visual fields) enrolled in the University of California, San Diego Diagnostic Innovations in Glaucoma Study (DIGS) were evaluated. Average mean deviation of patient eyes on standard automated perimetry was -1.81 dB (SD=2.61).
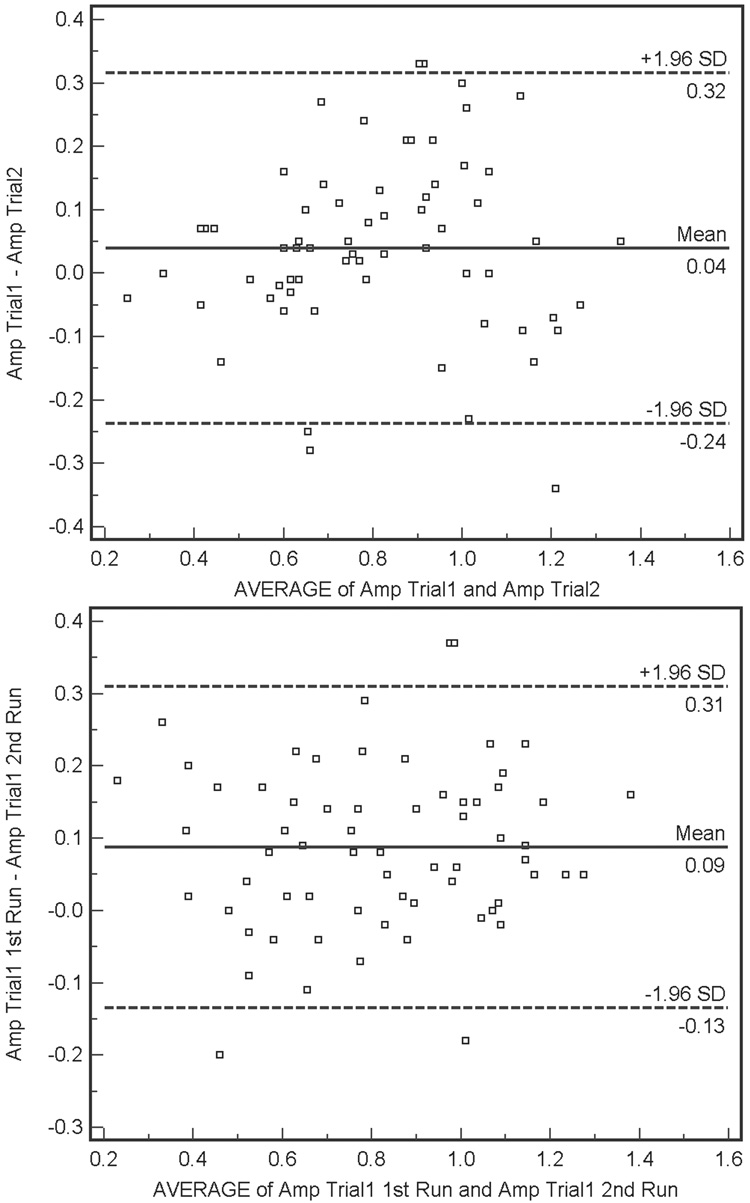
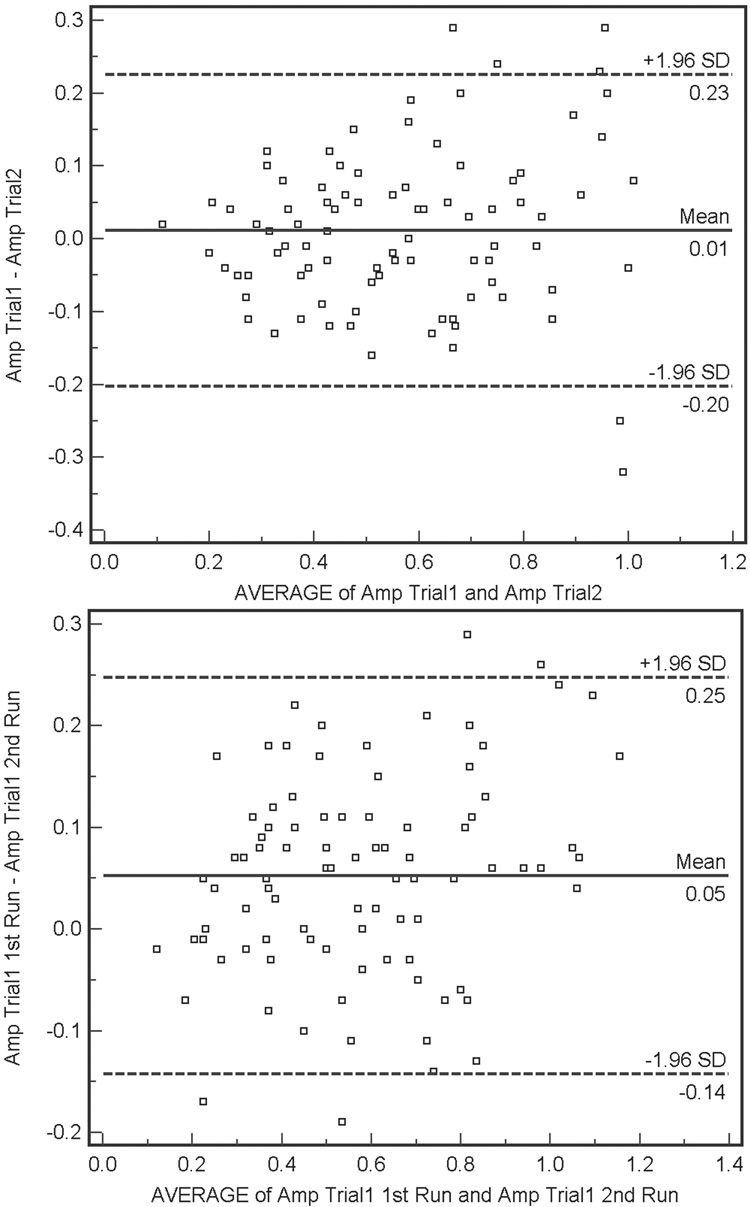
Methods: The PERG was recorded using the PERGLA paradigm from both eyes simultaneously twice (ie, 2 trials) by a single operator with electrodes being removed and reattached between recordings. Repeatability of PERG amplitude (microV) and phase (pi rad) between 2 runs within a single trial (within-trial condition) was compared with repeatability between 2 trials (ie, after electrode replacement, between-trial condition) by calculating the coefficients of variability (CVs) and the intraclass correlation coefficients (ICCs) and displaying Bland-Altman plots.
Results: For healthy eyes, amplitude CVs (SD) were 11.5% (11.5) and 9.9% (0.79) for within-trial and between-trial conditions, respectively. ICCs were 0.91 and 0.85. Phase CVs were 1.3% (1.5) (within-trials) and 1.5% (1.4) (between-trials) and ICCs were 0.85 and 0.88. For patient eyes, amplitude CVs (SD) were 12.2% (10.1) and 11.2% (7.5) for within-trial and between-trial conditions, respectively. ICCs were 0.92 and 0.89. Phase CVs were 2.2% (2.2) (within-trials) and 2.4% (2.2) (between-trials) and ICCs were 0.82 and 0.83. Bland-Altman plots indicated good agreement between the repeated recordings and were similar within-trials and between-trials for healthy and patient eyes.
Conclusions: Repeatability of PERGLA recordings is good and is similar within-trials and between-trials for both healthy and patient eyes suggesting this technique is promising for monitoring change over time.
Figures
References
-
- Bobak P, Bodis-Wollner I, Harnois C, et al. Pattern electroretinograms and visual-evoked potentials in glaucoma and multiple sclerosis. Am J Ophthalmol. 1983;96(1):72–83. - PubMed
-
- Ringens PJ, Vijfvinkel-Bruinenga S, van Lith GH. The pattern-elicited electroretinogram. I. A tool in the early detection of glaucoma? Ophthalmologica. 1986;192(3):171–175. - PubMed
-
- Price MJ, Drance SM, Price M, et al. The pattern electroretinogram and visual-evoked potential in glaucoma. Graefes Arch Clin Exp Ophthalmol. 1988;226(6):542–547. - PubMed
-
- Bach M, Speidel-Fiaux A. Pattern electroretinogram in glaucoma and ocular hypertension. Doc Ophthalmol. 1989;73(2):173–181. - PubMed
-
- Fiorentini A, Maffei L, Pirchio M, et al. The ERG in response to alternating gratings in patients with diseases of the peripheral visual pathway. Invest Ophthalmol Vis Sci. 1981;21(3):490–493. - PubMed
Publication types
MeSH terms
Grants and funding
LinkOut - more resources
Full Text Sources
Medical
Research Materials
Miscellaneous
