

Temporal controls of the asymmetric cell division cycle in Caulobacter crescentus
- PMID: 19680425
- PMCID: PMC2714070
- DOI: 10.1371/journal.pcbi.1000463
Temporal controls of the asymmetric cell division cycle in Caulobacter crescentus
Abstract
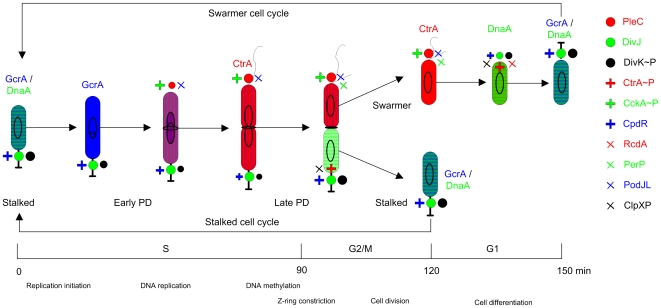
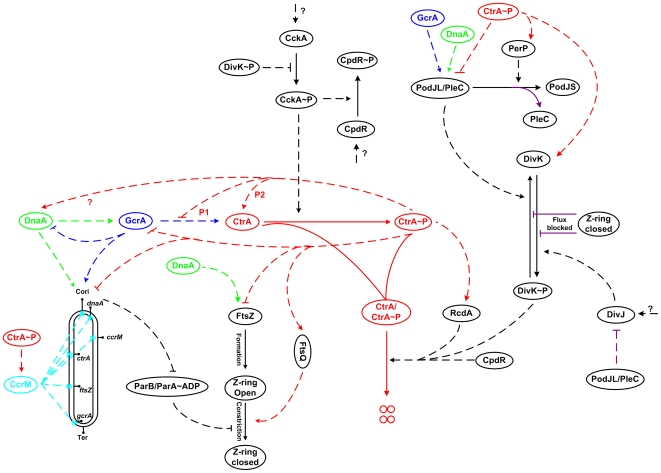
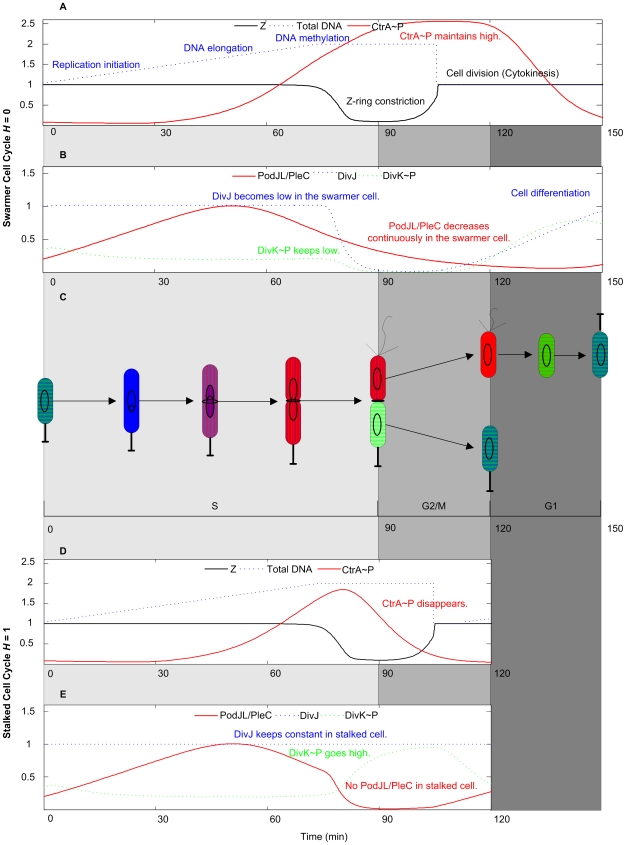
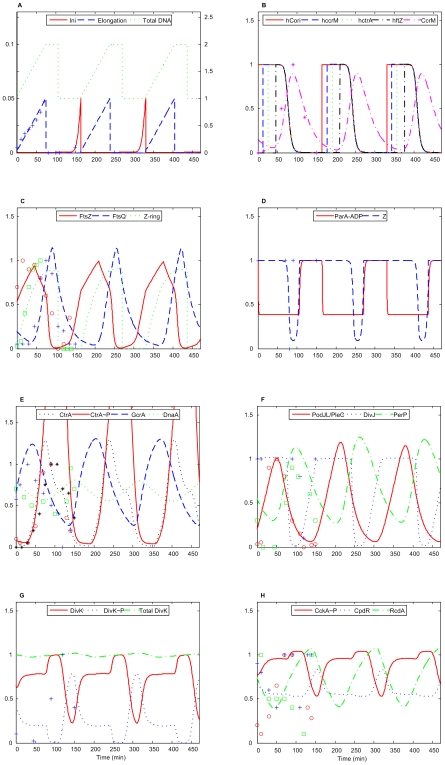
The asymmetric cell division cycle of Caulobacter crescentus is orchestrated by an elaborate gene-protein regulatory network, centered on three major control proteins, DnaA, GcrA and CtrA. The regulatory network is cast into a quantitative computational model to investigate in a systematic fashion how these three proteins control the relevant genetic, biochemical and physiological properties of proliferating bacteria. Different controls for both swarmer and stalked cell cycles are represented in the mathematical scheme. The model is validated against observed phenotypes of wild-type cells and relevant mutants, and it predicts the phenotypes of novel mutants and of known mutants under novel experimental conditions. Because the cell cycle control proteins of Caulobacter are conserved across many species of alpha-proteobacteria, the model we are proposing here may be applicable to other genera of importance to agriculture and medicine (e.g., Rhizobium, Brucella).
Conflict of interest statement
The authors have declared that no competing interests exist.
Figures

Similar articles
-
A quantitative study of the division cycle of Caulobacter crescentus stalked cells.PLoS Comput Biol. 2008 Jan;4(1):e9. doi: 10.1371/journal.pcbi.0040009. Epub 2007 Dec 5. PLoS Comput Biol. 2008. PMID: 18225942 Free PMC article.
-
Coupling of cell growth modulation to asymmetric division and cell cycle regulation in Caulobacter crescentus.Proc Natl Acad Sci U S A. 2024 Oct 8;121(41):e2406397121. doi: 10.1073/pnas.2406397121. Epub 2024 Oct 3. Proc Natl Acad Sci U S A. 2024. PMID: 39361646 Free PMC article.
-
Dynamical Localization of DivL and PleC in the Asymmetric Division Cycle of Caulobacter crescentus: A Theoretical Investigation of Alternative Models.PLoS Comput Biol. 2015 Jul 17;11(7):e1004348. doi: 10.1371/journal.pcbi.1004348. eCollection 2015 Jul. PLoS Comput Biol. 2015. PMID: 26186202 Free PMC article.
-
A genetic oscillator and the regulation of cell cycle progression in Caulobacter crescentus.Cell Cycle. 2004 Oct;3(10):1252-4. doi: 10.4161/cc.3.10.1181. Epub 2004 Oct 17. Cell Cycle. 2004. PMID: 15467452 Review.
-
Regulation of chromosomal replication in Caulobacter crescentus.Plasmid. 2012 Mar;67(2):76-87. doi: 10.1016/j.plasmid.2011.12.007. Epub 2011 Dec 29. Plasmid. 2012. PMID: 22227374 Review.
Cited by
-
Computational modeling of unphosphorylated CtrA:Cori binding in the Caulobacter cell cycle.iScience. 2021 Nov 10;24(12):103413. doi: 10.1016/j.isci.2021.103413. eCollection 2021 Dec 17. iScience. 2021. PMID: 34901785 Free PMC article.
-
Computational modeling of signaling pathways mediating cell cycle checkpoint control and apoptotic responses to ionizing radiation-induced DNA damage.Dose Response. 2012;10(2):251-73. doi: 10.2203/dose-response.11-021.Zhao. Epub 2011 Oct 25. Dose Response. 2012. PMID: 22740786 Free PMC article.
-
Stochastic modeling and simulation of reaction-diffusion system with Hill function dynamics.BMC Syst Biol. 2017 Mar 14;11(Suppl 3):21. doi: 10.1186/s12918-017-0401-9. BMC Syst Biol. 2017. PMID: 28361679 Free PMC article.
-
Transcriptomic and phylogenetic analysis of a bacterial cell cycle reveals strong associations between gene co-expression and evolution.BMC Genomics. 2013 Jul 5;14:450. doi: 10.1186/1471-2164-14-450. BMC Genomics. 2013. PMID: 23829427 Free PMC article.
-
Mathematical modeling of fission yeast Schizosaccharomyces pombe cell cycle: exploring the role of multiple phosphatases.Syst Synth Biol. 2011 Dec;5(3-4):115-29. doi: 10.1007/s11693-011-9090-7. Epub 2011 Dec 8. Syst Synth Biol. 2011. PMID: 23205155 Free PMC article.
References
-
- Novak B, Pataki Z, Ciliberto A, Tyson JJ. Mathematical model of the cell division cycle of fission yeast. Chaos. 2001;11:277–286. - PubMed
-
- Novak B, Csikasz-Nagy A, Gyorffy B, Chen K, Tyson JJ. Mathematical model of the fission yeast cell cycle with checkpoint controls at the G1/S, G2/M and metaphase/anaphase transitions. BiophysChem. 1998;72:185–200. - PubMed
-
- Tyson JJ, Chen K, Novak B. Network dynamics and cell physiology. NatRevMolCell Biol. 2001;2:908–916. - PubMed
-
- Marlovits G, Tyson CJ, Novak B, Tyson JJ. Modeling M-phase control in Xenopus oocyte extracts: the surveillance mechanism for unreplicated DNA. BiophysChem. 1998;72:169–184. - PubMed
Publication types
MeSH terms
Substances
LinkOut - more resources
Full Text Sources
Molecular Biology Databases
Miscellaneous
